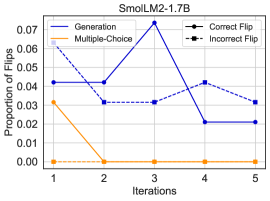
## Line Chart: Proportion of Flips in SmolLM2-1.7B Across Iterations
### Overview
The chart visualizes the proportion of "flips" (likely model behavior changes) across five iterations for two methods: "Generation" (blue line) and "Multiple-Choice" (orange line). A legend distinguishes "Correct Flip" (solid line) and "Incorrect Flip" (dashed line), though only solid lines are present in the chart.
### Components/Axes
- **X-axis (Iterations)**: Labeled "Iterations" with discrete markers at 1, 2, 3, 4, 5.
- **Y-axis (Proportion of Flips)**: Ranges from 0.00 to 0.07 in increments of 0.01.
- **Legend**: Located in the top-right corner, with:
- Solid line: "Correct Flip"
- Dashed line: "Incorrect Flip"
- **Lines**:
- Blue solid line: "Generation"
- Orange solid line: "Multiple-Choice"
### Detailed Analysis
1. **Generation (Blue Line)**:
- Iteration 1: ~0.04
- Iteration 2: ~0.03
- Iteration 3: Peaks at ~0.07
- Iteration 4: Drops to ~0.02
- Iteration 5: Remains at ~0.02
- **Trend**: Initial decline, sharp peak at iteration 3, then stabilization at lower values.
2. **Multiple-Choice (Orange Line)**:
- Iteration 1: ~0.03
- Iterations 2–5: Drops to 0.00 and remains flat.
- **Trend**: Immediate collapse to zero after iteration 1.
3. **Legend Consistency**:
- Both lines are solid, conflicting with the legend's "Incorrect Flip" (dashed) label. This suggests either a chart error or mislabeling.
### Key Observations
- **Generation** exhibits volatility, with a significant spike at iteration 3 followed by a sharp decline.
- **Multiple-Choice** shows no activity beyond iteration 1, dropping to zero and remaining flat.
- The legend's "Incorrect Flip" label is not visually represented in the chart, creating ambiguity.
### Interpretation
- The **Generation** method demonstrates dynamic behavior, with flips peaking at iteration 3 before stabilizing. This could indicate adaptive learning or model instability during training.
- The **Multiple-Choice** method's abrupt drop to zero suggests it either fails to generate flips after the first iteration or is designed to suppress flips entirely.
- The legend's mismatch (solid lines vs. "Incorrect Flip" dashed label) raises questions about data accuracy or chart design. If "Incorrect Flip" were represented, it might imply a subset of flips being misclassified, but this is speculative without visual evidence.
- The stark contrast between the two methods highlights differing strategies: Generation allows for variable flips, while Multiple-Choice enforces strict suppression after iteration 1.