## System Architecture and RNG Characteristics
### Overview
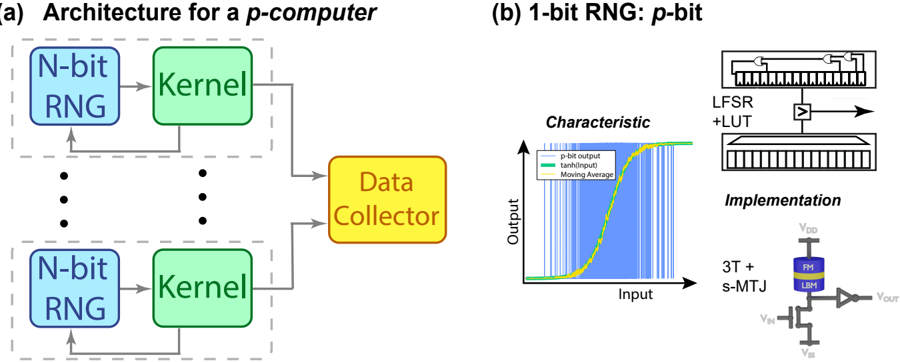
The image presents two diagrams. Diagram (a) illustrates the architecture for a p-computer, showing interconnected N-bit Random Number Generators (RNGs), Kernels, and a Data Collector. Diagram (b) details a 1-bit RNG, including its characteristic curve and implementation details.
### Components/Axes
#### Diagram (a): Architecture for a p-computer
* **Title:** Architecture for a p-computer
* **Components:**
* N-bit RNG (light blue rounded rectangle)
* Kernel (light green rounded rectangle)
* Data Collector (yellow rounded rectangle)
* **Flow:** N-bit RNG -> Kernel -> Data Collector. There is also a feedback loop from the Kernel back to the N-bit RNG. The entire structure is repeated multiple times, indicated by ellipsis.
#### Diagram (b): 1-bit RNG: p-bit
* **Title:** 1-bit RNG: p-bit
* **Sub-diagram 1: Characteristic**
* **Axes:**
* X-axis: Input
* Y-axis: Output
* **Data Series (Legend, located at the top-center of the sub-diagram):**
* p-bit output (light blue vertical lines)
* tanh(Input) (light green line)
* Moving Average (light yellow line)
* **Sub-diagram 2: LFSR + LUT**
* Shows a Linear Feedback Shift Register (LFSR) combined with a Look-Up Table (LUT).
* **Sub-diagram 3: Implementation**
* Shows a circuit diagram including:
* VDD (supply voltage)
* 3T + s-MTJ (3 Transistors + spin-Magnetic Tunnel Junction)
* FM (Ferromagnetic layer)
* LBM (Layer Below Magnetic layer)
* VIN (input voltage)
* VSS (ground voltage)
* VOUT (output voltage)
### Detailed Analysis
#### Diagram (a): Architecture for a p-computer
The architecture consists of multiple parallel units. Each unit contains an N-bit RNG that feeds into a Kernel. The output of the Kernels is collected by a Data Collector. There is a feedback loop from the Kernel back to the N-bit RNG.
#### Diagram (b): 1-bit RNG: p-bit
* **Characteristic Curve:** The "p-bit output" is represented by a series of light blue vertical lines, showing a noisy output. The "tanh(Input)" is a light green sigmoid curve, representing a hyperbolic tangent function of the input. The "Moving Average" is a light yellow line that smooths out the p-bit output, closely following the tanh(Input) curve.
* **LFSR + LUT:** The diagram shows a basic structure of an LFSR combined with a LUT, which is used to generate pseudo-random numbers.
* **Implementation:** The circuit diagram shows a 3T + s-MTJ implementation, which includes a spin-MTJ device.
### Key Observations
* **Diagram (a):** The architecture is parallel, suggesting that the p-computer utilizes multiple RNGs and Kernels to generate and process data.
* **Diagram (b):** The characteristic curve shows that the p-bit output is noisy, but the moving average smooths it out to approximate a tanh function. The implementation uses a 3T + s-MTJ circuit.
### Interpretation
The diagrams illustrate the architecture and implementation of a p-computer and its 1-bit RNG component. The parallel architecture in (a) suggests a design for high throughput or parallel processing. The characteristic curve in (b) shows the behavior of the 1-bit RNG, where the moving average of the noisy p-bit output approximates a tanh function, which is likely used for some form of probabilistic computation. The implementation details in (b) indicate the use of spintronic devices (s-MTJ) in the RNG design.