TECHNICAL ASSET FINGERPRINT
46899c0640a75a4903d4856b
Click to view fullscreen
Press ESC or click to close
FOUND IN PAPERS
EXPERT: healer-alpha-free VERSION 1
RUNTIME: free/openrouter/healer-alpha
INTEL_VERIFIED
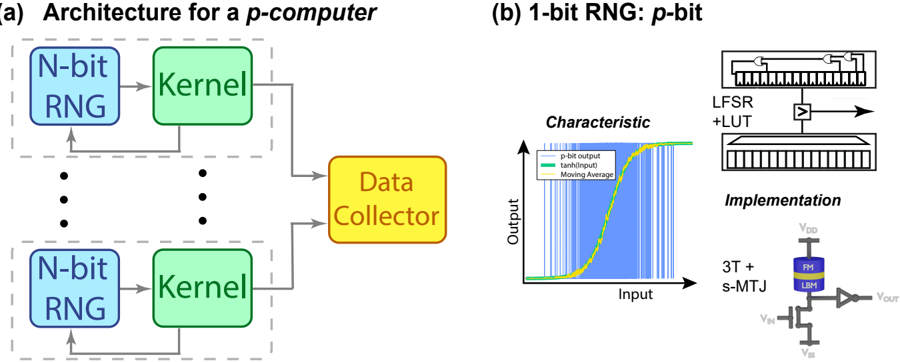
## Diagram: Architecture and Implementation of a p-computer and its 1-bit RNG (p-bit)
### Overview
The image is a two-part technical diagram illustrating the architecture of a probabilistic computer ("p-computer") and the detailed design of its fundamental component, a 1-bit random number generator called a "p-bit." Part (a) shows a high-level system architecture, while part (b) delves into the characteristic behavior and hardware implementation of a single p-bit.
### Components/Axes
**Part (a): Architecture for a p-computer**
* **Components:**
* **N-bit RNG:** Blue rectangular blocks. Multiple instances are shown, arranged vertically with ellipsis dots (`...`) indicating a scalable number.
* **Kernel:** Green rectangular blocks. Each is paired with one N-bit RNG block.
* **Data Collector:** A single yellow rectangular block.
* **Flow/Connections:** Arrows indicate data flow. Each `N-bit RNG` feeds into its corresponding `Kernel`. All `Kernel` blocks then feed their outputs into the central `Data Collector`.
**Part (b): 1-bit RNG: p-bit**
This section is subdivided into three areas:
1. **Characteristic Plot (Left):**
* **Type:** Line chart.
* **X-axis:** Label: "Input". No numerical markers are visible.
* **Y-axis:** Label: "Output". No numerical markers are visible.
* **Legend (Top-Left of plot area):**
* Blue line: "p-bit output"
* Green line: "Sigmoid function"
* Yellow dashed line: "Moving Average"
* **Data Series:**
* **p-bit output (Blue):** A highly noisy, rapidly fluctuating signal that generally follows the sigmoid curve. It appears as a dense, vertical blue fill or very high-frequency oscillation between two levels.
* **Sigmoid function (Green):** A smooth, S-shaped curve that transitions from a low output level to a high output level as the input increases.
* **Moving Average (Yellow Dashed):** A smoothed version of the blue "p-bit output" signal, closely tracking the green sigmoid curve.
2. **Implementation - Digital Block Diagram (Top Right):**
* **Label:** "Implementation"
* **Components:**
* **LFSR + LUT:** A block containing two sub-blocks.
* Top sub-block: A diagram of a Linear Feedback Shift Register (LFSR), shown as a series of connected boxes (flip-flops) with a feedback loop.
* Bottom sub-block: A Look-Up Table (LUT), shown as a block with multiple input lines converging into a single output line.
* An arrow points from the LFSR+LUT block to the right, indicating an output.
3. **Implementation - Circuit Schematic (Bottom Right):**
* **Components:**
* **VDD:** Positive power supply terminal.
* **FM:** A component labeled "FM" (likely a ferromagnet or magnetic layer).
* **LB:** A component labeled "LB" (likely a "local bit" line or similar).
* **3T + s-MTJ:** The label for the circuit, indicating 3 Transistors plus a spin-transfer torque Magnetic Tunnel Junction.
* **Transistors:** Three NMOS transistor symbols.
* **V_IN:** Input voltage terminal connected to the gate of one transistor.
* **V_SS:** Negative/power supply terminal.
* **V_OUT:** Output voltage terminal, taken from a node between the LB component and an inverter/buffer symbol.
### Detailed Analysis
* **System Architecture (a):** The diagram depicts a parallel, modular architecture. Multiple probabilistic units (each an N-bit RNG + Kernel) operate concurrently. Their results are aggregated by a central Data Collector, suggesting a Monte Carlo or ensemble computing method.
* **p-bit Characteristic (b, Left Plot):** The core function of the p-bit is visualized. For a given analog "Input," the p-bit produces a noisy, digital "Output" that probabilistically follows a sigmoid function. The "Moving Average" of this noisy output converges to the deterministic sigmoid curve. This demonstrates the p-bit's role as a tunable random bit whose probability of being '1' is controlled by the input via a sigmoidal relationship.
* **p-bit Implementation (b, Right):** Two implementation strategies are shown:
1. **Digital Emulation:** Using a Linear Feedback Shift Register (LFSR) for pseudo-random number generation and a Look-Up Table (LUT) to implement the sigmoid mapping.
2. **Native Spintronic Device:** A circuit labeled "3T + s-MTJ" uses three transistors and a spintronic device (the s-MTJ, represented by the FM/LB stack) to physically generate the probabilistic bit. The input voltage `V_IN` modulates the switching probability of the magnetic tunnel junction, directly realizing the sigmoidal characteristic in hardware.
### Key Observations
1. The "p-bit output" (blue) in the characteristic plot is not a clean binary signal but a rapidly toggling one, with its *average* behavior defined by the sigmoid.
2. The implementation section contrasts a conventional digital approach (LFSR+LUT) with a specialized analog/spintronic circuit (3T+s-MTJ), highlighting a potential hardware advantage for the latter in terms of native stochasticity.
3. The architecture in (a) is generic; the "Kernel" block's specific function is not defined, but it presumably processes the probabilistic outputs from the RNGs.
### Interpretation
This diagram explains the foundational concept of a "p-computer," which leverages probabilistic bits (p-bits) as its basic computational element, unlike classical computers using deterministic bits.
* **What the data suggests:** The sigmoidal characteristic is crucial. It means the p-bit is not purely random; its probability is *controllable*. An input of 0 might yield a 10% chance of outputting '1', while an input of 1 might yield a 90% chance. This tunable randomness is the key to performing probabilistic inference, optimization, and sampling tasks efficiently.
* **How elements relate:** The p-bit (b) is the atomic unit. Many such units, possibly with different parameters or connected to different data, form the parallel architecture in (a). The "Kernel" likely applies a problem-specific function to the random numbers generated by the p-bits, and the "Data Collector" aggregates these results to compute a final probabilistic answer.
* **Notable implications:** The inclusion of a spintronic implementation (3T+s-MTJ) suggests this architecture is aimed at creating energy-efficient, hardware-native probabilistic computers. The noisy blue signal in the plot is not a flaw but the essential feature—the very source of the useful randomness that the system harnesses. The moving average (yellow) represents the classical, deterministic function that the probabilistic hardware approximates through repeated sampling.
DECODING INTELLIGENCE...