## Chart/Diagram Type: Composite Figure
### Overview
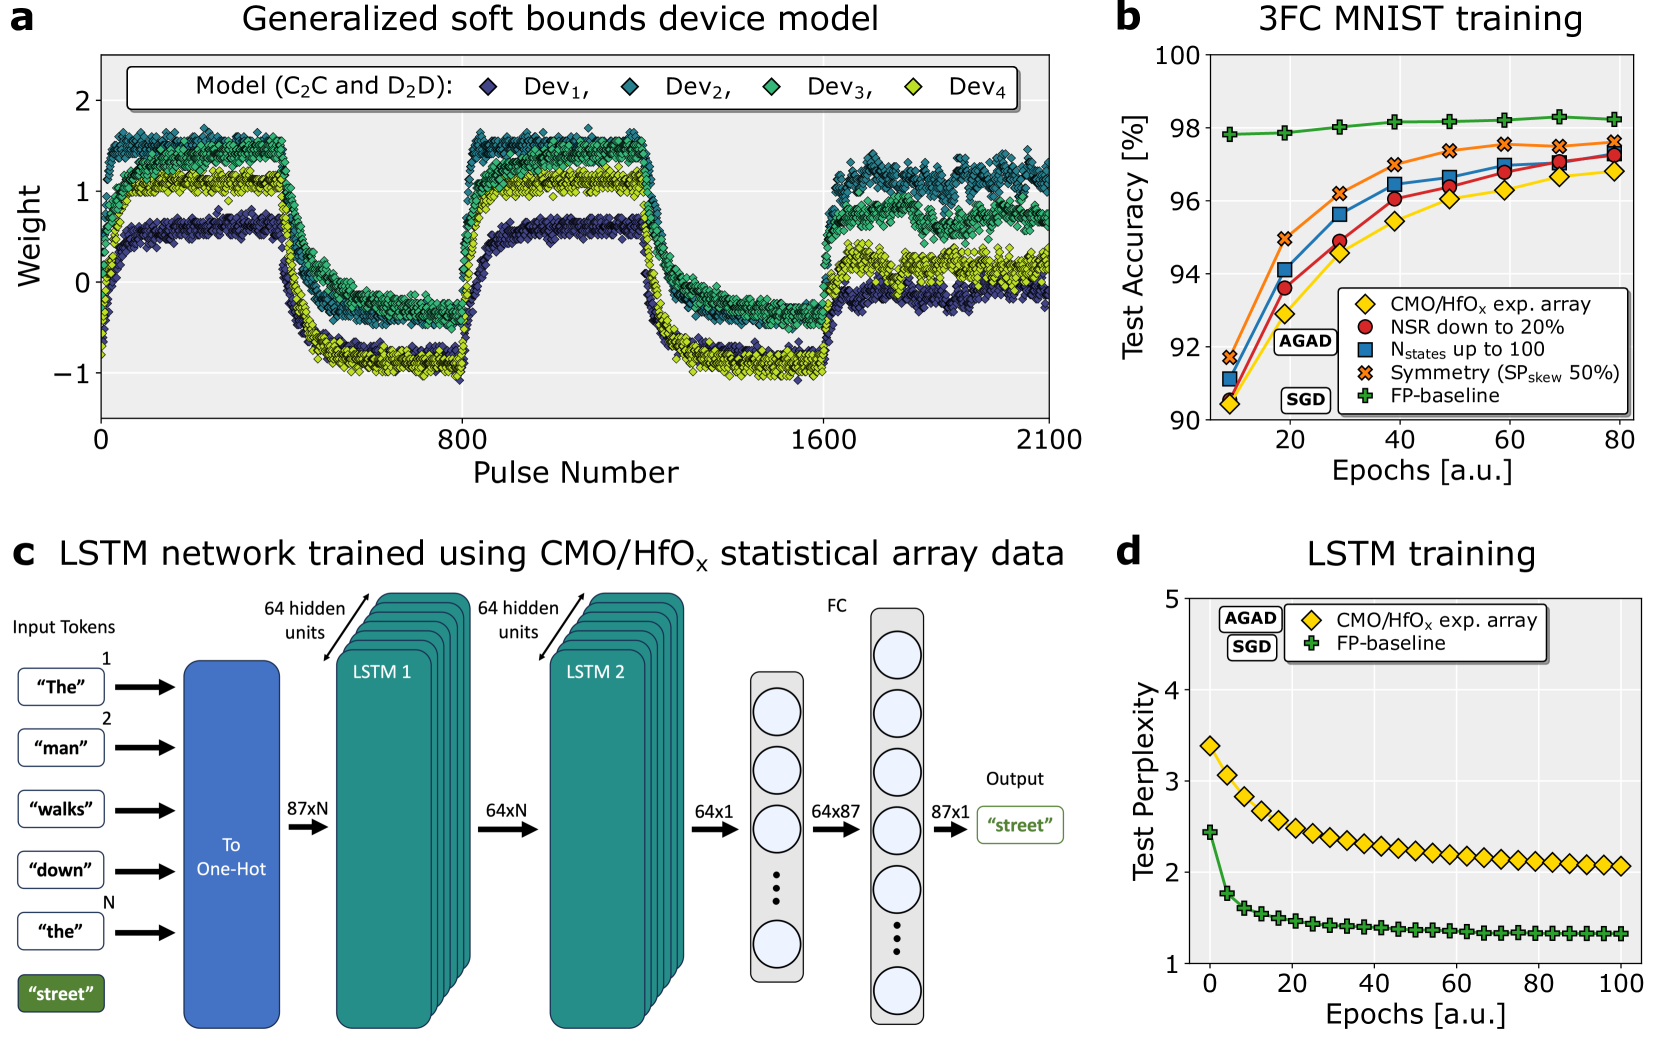
The image presents a composite figure comprising four sub-figures (a, b, c, and d) that relate to device modeling, neural network training, and performance evaluation. Sub-figure (a) displays the weight changes of different devices over pulse numbers. Sub-figure (b) shows the test accuracy of a 3FC MNIST training model over epochs. Sub-figure (c) illustrates an LSTM network trained using CMO/HfOx statistical array data. Sub-figure (d) presents the test perplexity of LSTM training over epochs.
### Components/Axes
**Sub-figure a: Generalized soft bounds device model**
* **Title:** Generalized soft bounds device model
* **X-axis:** Pulse Number, ranging from 0 to 2100. Axis markers are present at 0, 800, 1600, and 2100.
* **Y-axis:** Weight, ranging from -1 to 2. Axis markers are present at -1, 0, 1, and 2.
* **Legend (top-center):** Model (C2C and D2D):
* Dev1 (dark blue diamonds)
* Dev2 (dark green diamonds)
* Dev3 (light green diamonds)
* Dev4 (yellow-green diamonds)
**Sub-figure b: 3FC MNIST training**
* **Title:** 3FC MNIST training
* **X-axis:** Epochs [a.u.], ranging from 20 to 80. Axis markers are present at 20, 40, 60, and 80.
* **Y-axis:** Test Accuracy [%], ranging from 90 to 100. Axis markers are present at 90, 92, 94, 96, 98, and 100.
* **Legend (right-center):**
* CMO/HfOx exp. array (yellow diamonds)
* NSR down to 20% (red circles)
* Nstates up to 100 (blue squares)
* Symmetry (SPskew 50%) (brown crosses)
* FP-baseline (green plus signs)
* AGAD (no marker specified, inferred from plot)
* SGD (no marker specified, inferred from plot)
**Sub-figure c: LSTM network trained using CMO/HfOx statistical array data**
* **Title:** LSTM network trained using CMO/HfOx statistical array data
* **Components:**
* Input Tokens (left): "The", "man", "walks", "down", "the", "street"
* To One-Hot (left-center)
* LSTM 1: 64 hidden units, 87xN
* LSTM 2: 64 hidden units, 64xN
* FC (Fully Connected Layer) (right-center)
* Output (right): "street", 87x1, 64x87, 64x1
**Sub-figure d: LSTM training**
* **Title:** LSTM training
* **X-axis:** Epochs [a.u.], ranging from 0 to 100. Axis markers are present at 0, 20, 40, 60, 80, and 100.
* **Y-axis:** Test Perplexity, ranging from 1 to 5. Axis markers are present at 1, 2, 3, 4, and 5.
* **Legend (top-left):**
* CMO/HfOx exp. array (yellow diamonds)
* FP-baseline (green plus signs)
* AGAD (no marker specified, inferred from plot)
* SGD (no marker specified, inferred from plot)
### Detailed Analysis
**Sub-figure a: Generalized soft bounds device model**
* **Dev1 (dark blue diamonds):** Starts around 0.25, decreases to -0.75 around pulse number 800, then increases back to approximately 0.25 around pulse number 1600, and remains stable.
* **Dev2 (dark green diamonds):** Starts around 1.25, decreases to -0.25 around pulse number 800, then increases back to approximately 1.25 around pulse number 1600, and remains stable.
* **Dev3 (light green diamonds):** Starts around 1.5, decreases to -0.5 around pulse number 800, then increases back to approximately 1.5 around pulse number 1600, and remains stable.
* **Dev4 (yellow-green diamonds):** Starts around 1.75, decreases to -0.75 around pulse number 800, then increases back to approximately 1.75 around pulse number 1600, and remains stable.
**Sub-figure b: 3FC MNIST training**
* **CMO/HfOx exp. array (yellow diamonds):** Starts at approximately 90% accuracy at 20 epochs, increases to approximately 97% accuracy by 80 epochs.
* **NSR down to 20% (red circles):** Starts at approximately 92% accuracy at 20 epochs, increases to approximately 97.5% accuracy by 80 epochs.
* **Nstates up to 100 (blue squares):** Starts at approximately 93% accuracy at 20 epochs, increases to approximately 97% accuracy by 80 epochs.
* **Symmetry (SPskew 50%) (brown crosses):** Starts at approximately 91.5% accuracy at 20 epochs, increases to approximately 97.5% accuracy by 80 epochs.
* **FP-baseline (green plus signs):** Remains relatively stable at approximately 98% accuracy across all epochs.
**Sub-figure d: LSTM training**
* **CMO/HfOx exp. array (yellow diamonds):** Starts at approximately 3.5 perplexity at 0 epochs, decreases to approximately 2 perplexity by 100 epochs.
* **FP-baseline (green plus signs):** Starts at approximately 2.5 perplexity at 0 epochs, decreases to approximately 1.3 perplexity by 100 epochs.
### Key Observations
* In sub-figure (a), all four devices show a similar trend: a decrease in weight followed by an increase, suggesting a write-erase-write cycle.
* In sub-figure (b), the FP-baseline consistently outperforms the other training methods in terms of test accuracy.
* In sub-figure (d), the FP-baseline achieves lower test perplexity compared to the CMO/HfOx exp. array, indicating better performance.
### Interpretation
The data presented suggests that the FP-baseline method is more effective for both MNIST training (higher accuracy) and LSTM training (lower perplexity) compared to the other methods tested. The device model in sub-figure (a) demonstrates the ability of the devices to switch between states, which is crucial for memory applications. The LSTM network diagram in sub-figure (c) provides a visual representation of the network architecture used for the LSTM training. The combination of these sub-figures provides a comprehensive overview of the device characteristics, network architecture, and training performance.