## Histogram: First Correct Answer Emergence in Decoding Steps
### Overview
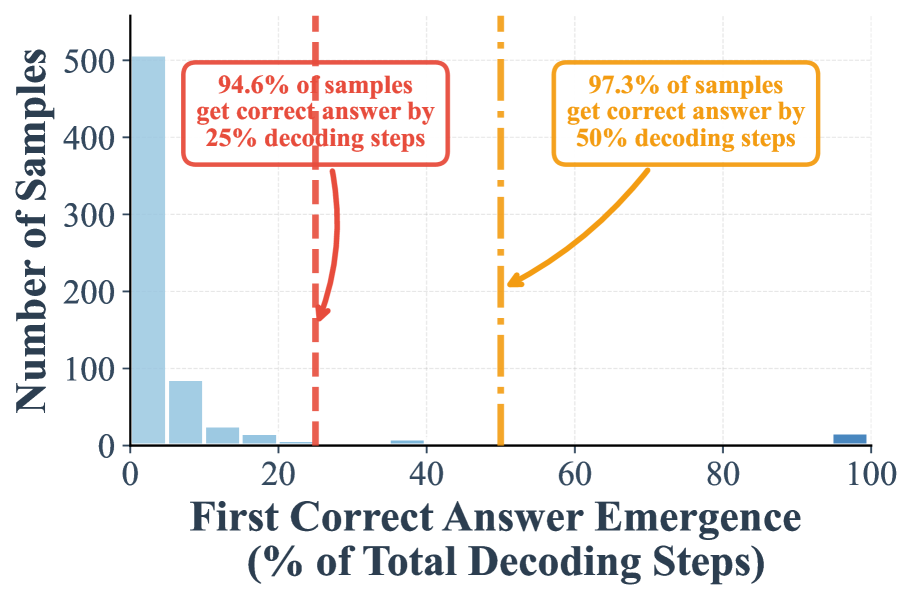
The image is a histogram chart illustrating the distribution of when a model first produces a correct answer during a decoding process, measured as a percentage of the total decoding steps allocated. The chart includes two key cumulative performance annotations.
### Components/Axes
* **X-Axis (Horizontal):** Labeled "First Correct Answer Emergence (% of Total Decoding Steps)". The scale runs from 0 to 100, with major tick marks at 0, 20, 40, 60, 80, and 100.
* **Y-Axis (Vertical):** Labeled "Number of Samples". The scale runs from 0 to 500, with major tick marks at 0, 100, 200, 300, 400, and 500.
* **Data Series:** A single data series represented by light blue vertical bars (a histogram). The bars show the frequency (count) of samples whose first correct answer emerged within specific percentage bins of the total decoding steps.
* **Annotations:**
1. **Red Annotation (Left):** A red dashed vertical line is positioned at approximately the 25% mark on the x-axis. A red-bordered text box with an arrow pointing to this line contains the text: "94.6% of samples get correct answer by 25% decoding steps".
2. **Orange Annotation (Right):** An orange dashed vertical line is positioned at the 50% mark on the x-axis. An orange-bordered text box with an arrow pointing to this line contains the text: "97.3% of samples get correct answer by 50% decoding steps".
### Detailed Analysis
* **Histogram Distribution:** The distribution is heavily right-skewed. The tallest bar is in the first bin (0-5% of steps), reaching the top of the y-axis at 500 samples. The frequency drops sharply in the subsequent bins:
* Bin ~5-10%: Approximately 80 samples.
* Bin ~10-15%: Approximately 20 samples.
* Bin ~15-20%: Approximately 10 samples.
* Bins from ~20% to ~95%: Very low frequencies, with most bins containing 0-5 samples. There is a small, isolated bar in the final bin (~95-100%), representing approximately 10-15 samples.
* **Cumulative Performance:** The annotations provide cumulative statistics:
* By the 25% decoding step mark, 94.6% of all samples have already achieved their first correct answer.
* By the 50% decoding step mark, 97.3% of all samples have achieved their first correct answer. This indicates that only 2.7% of samples require more than half of the allocated decoding steps to first become correct.
### Key Observations
1. **Extreme Early Convergence:** The vast majority of samples (the mode) achieve their first correct answer almost immediately, within the first 5% of decoding steps.
2. **Rapid Saturation:** The cumulative performance reaches 94.6% by the 25% mark, showing that the process is highly efficient for most cases.
3. **Long Tail:** There is a very long, thin tail to the right. A small but non-zero number of samples require nearly the entire decoding budget (approaching 100%) to first produce a correct answer.
4. **Annotation Placement:** The red (25%) and orange (50%) dashed lines and their corresponding text boxes are placed in the upper portion of the chart area, clearly above the histogram bars, to avoid obscuring the data.
### Interpretation
This histogram demonstrates the efficiency and behavior of a decoding or generation process (likely for a language or reasoning model). The data suggests that for the given task and model, **correct solutions emerge very early in the process for the overwhelming majority of inputs**. The process exhibits a "quick win" characteristic.
The key insight is the disconnect between the *emergence of a correct answer* and the *full allocation of decoding steps*. The model often finds the correct path early but may continue generating for the full allocated budget. The small cluster of samples in the 95-100% range represents "hard" problems where the model struggles and only finds the correct answer at the very end of its allowed computation, or possibly where the correct answer is only validated as such at the final step. The jump from 94.6% at 25% steps to 97.3% at 50% steps shows diminishing returns; allocating more than 50% of the steps yields only a 2.7% gain in the proportion of samples that have *ever* been correct. This has implications for resource allocation, suggesting that early stopping criteria could be highly effective without sacrificing performance on most samples.