## Bar Chart: First Correct Answer Emergence (% of Total Decoding Steps)
### Overview
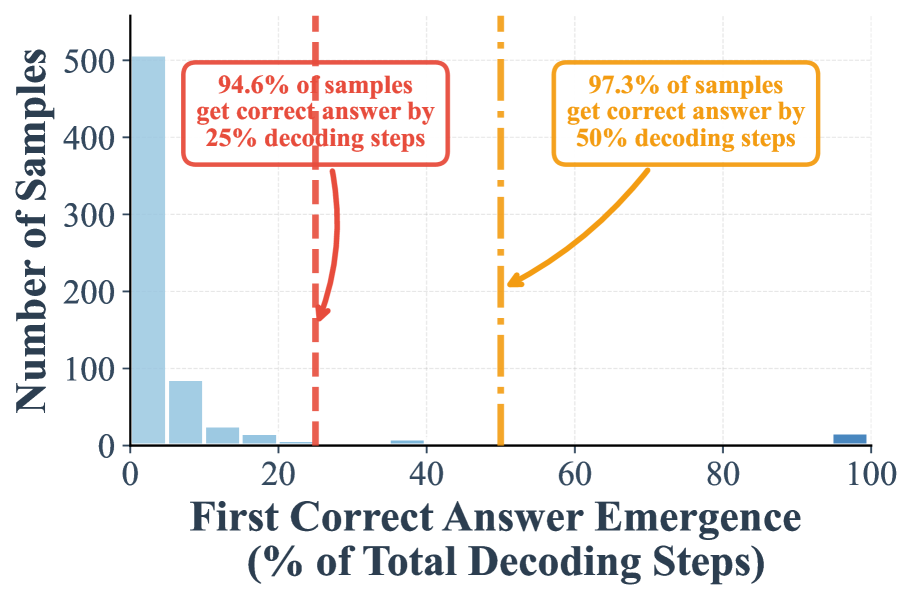
The chart visualizes the distribution of samples based on the percentage of total decoding steps required to achieve the first correct answer. Two key thresholds (25% and 50% decoding steps) are highlighted, with annotations indicating cumulative percentages of samples achieving correctness by those steps.
### Components/Axes
- **X-axis**: "First Correct Answer Emergence (% of Total Decoding Steps)" with markers at 0%, 20%, 40%, 60%, 80%, and 100%.
- **Y-axis**: "Number of Samples" scaled from 0 to 500 in increments of 100.
- **Legend**: Implicitly defined by bar colors:
- **Blue bar**: 25% decoding steps (500 samples).
- **Orange bar**: 50% decoding steps (200 samples).
- **Annotations**:
- Red dashed line at 25% decoding steps with text: "94.6% of samples get correct answer by 25% decoding steps."
- Orange dotted line at 50% decoding steps with text: "97.3% of samples get correct answer by 50% decoding steps."
### Detailed Analysis
- **Blue Bar (25% decoding steps)**:
- Height: ~500 samples.
- Position: Leftmost bar, centered at 25% on the x-axis.
- **Orange Bar (50% decoding steps)**:
- Height: ~200 samples.
- Position: Right of the blue bar, centered at 50% on the x-axis.
- **Annotations**:
- Red box (25%): Indicates 94.6% of total samples achieve correctness by 25% decoding steps.
- Orange box (50%): Indicates 97.3% of total samples achieve correctness by 50% decoding steps.
### Key Observations
1. **Dominance at 25% decoding steps**: The majority of samples (500) achieve correctness at 25% decoding steps, with 94.6% of total samples reaching the correct answer by this threshold.
2. **Drop in sample count at 50%**: Only 200 samples require 50% decoding steps, but this group contributes to the remaining 2.7% of samples achieving correctness (97.3% total).
3. **Cumulative correctness**: The annotations suggest near-universal correctness (97.3%) by 50% decoding steps, with minimal additional samples requiring further steps.
### Interpretation
The data demonstrates that **most samples (94.6%) resolve correctly within 25% of decoding steps**, while a smaller subset (2.7%) requires up to 50% decoding steps to achieve correctness. This implies:
- **Efficiency**: The system performs well for the majority of cases, with rapid convergence to correct answers.
- **Long-tail challenges**: A minority of samples (2.7%) demand significantly more computational effort, highlighting potential edge cases or complex scenarios.
- **Diminishing returns**: Increasing decoding steps beyond 25% yields only marginal improvements in correctness (2.7% additional samples), suggesting optimization opportunities for resource allocation.
The chart underscores a trade-off between computational cost and correctness, with the bulk of samples resolving efficiently but a small fraction requiring disproportionate resources.