## Chart: NMSE vs. Iterations for LLMSR and PIT-PO
### Overview
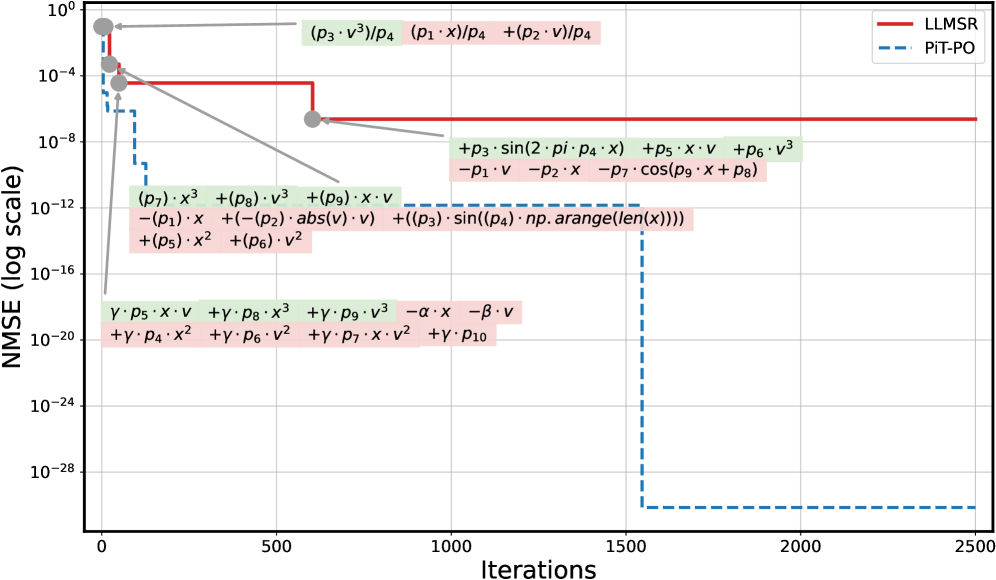
The image is a line chart comparing the performance of two algorithms, LLMSR (red line) and PIT-PO (blue dashed line), in terms of NMSE (Normalized Mean Squared Error) on a logarithmic scale, plotted against the number of iterations. The chart also includes annotations with mathematical expressions, seemingly related to the algorithms or the data they process.
### Components/Axes
* **X-axis:** Iterations, ranging from 0 to 2500. Axis markers are present at 0, 500, 1000, 1500, 2000, and 2500.
* **Y-axis:** NMSE (log scale), ranging from 10<sup>0</sup> to 10<sup>-28</sup>. Axis markers are present at 10<sup>0</sup>, 10<sup>-4</sup>, 10<sup>-8</sup>, 10<sup>-12</sup>, 10<sup>-16</sup>, 10<sup>-20</sup>, 10<sup>-24</sup>, and 10<sup>-28</sup>.
* **Legend:** Located in the top-right corner.
* LLMSR: Represented by a solid red line.
* PIT-PO: Represented by a dashed blue line.
* **Annotations:** Several mathematical expressions are scattered across the chart, enclosed in green and pink boxes. These expressions involve variables like *x*, *v*, *p*<sub>*i*</sub>, *α*, *β*, and *γ*.
### Detailed Analysis
* **LLMSR (Red Line):**
* Trend: The LLMSR line starts at approximately 10<sup>-2</sup>, drops to approximately 10<sup>-4</sup> within the first 50 iterations, remains relatively constant until around 500 iterations, then drops again to approximately 10<sup>-7</sup>, and remains constant for the rest of the iterations.
* Data Points:
* Iteration 0: NMSE ≈ 10<sup>-2</sup>
* Iteration 50: NMSE ≈ 10<sup>-4</sup>
* Iteration 500: NMSE ≈ 10<sup>-4</sup>
* Iteration 750: NMSE ≈ 10<sup>-7</sup>
* Iteration 2500: NMSE ≈ 10<sup>-7</sup>
* **PIT-PO (Blue Dashed Line):**
* Trend: The PIT-PO line starts at approximately 10<sup>-2</sup>, drops sharply to approximately 10<sup>-6</sup> within the first 50 iterations, then drops again to approximately 10<sup>-28</sup> around 1500 iterations, where it remains constant.
* Data Points:
* Iteration 0: NMSE ≈ 10<sup>-2</sup>
* Iteration 50: NMSE ≈ 10<sup>-6</sup>
* Iteration 1500: NMSE ≈ 10<sup>-28</sup>
* Iteration 2500: NMSE ≈ 10<sup>-28</sup>
* **Mathematical Expressions:**
* Green Boxes (examples): (p3 * v<sup>3</sup>)/p4, (p1 * x)/p4 + (p2 * v)/p4, +p3 * sin(2 * pi * p4 * x) + p5 * x * v + p6 * v<sup>3</sup> - p1 * v - p2 * x - p7 * cos(p9 * x + p8), γ * p5 * x * v + γ * p8 * x<sup>3</sup> + γ * p9 * v<sup>3</sup> - α * x - β * v
* Pink Boxes (examples): (p7) * x<sup>3</sup> + (p8) * v<sup>3</sup> + (p9) * x * v - (p1) * x + (-(p2) * abs(v) * v) + ((p3) * sin((p4) * np.arange(len(x)))), + γ * p4 * x<sup>2</sup> + γ * p6 * v<sup>2</sup> + γ * p7 * x * v<sup>2</sup> + γ * p10
### Key Observations
* Both algorithms start with similar NMSE values.
* PIT-PO converges much faster and reaches a significantly lower NMSE than LLMSR.
* LLMSR plateaus at a higher NMSE value.
* The mathematical expressions are likely related to the computations performed within each iteration of the algorithms.
### Interpretation
The chart demonstrates that PIT-PO outperforms LLMSR in terms of NMSE for the given problem. PIT-PO converges to a much lower error rate with fewer iterations. The mathematical expressions suggest that the algorithms involve various parameters (p1-p10, alpha, beta, gamma) and operations on input variables *x* and *v*. The expressions might represent different components or regularization terms within the algorithms. The rapid convergence of PIT-PO suggests it may be more efficient or better suited for the specific task being evaluated. The annotations are spatially linked to the data points, suggesting that the expressions are relevant to the algorithm's behavior at those specific iterations or NMSE levels.