## Chart: AlphaEvolve Score vs. Optimal Score
### Overview
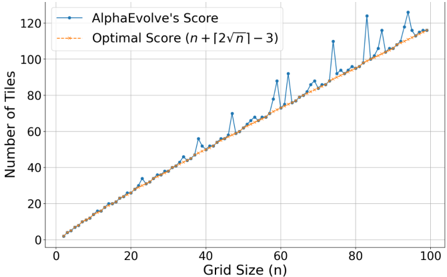
The image presents a line chart comparing the performance of "AlphaEvolve's Score" against an "Optimal Score" as a function of "Grid Size (n)". The chart visualizes the number of tiles achieved by each method for grid sizes ranging from 0 to 100.
### Components/Axes
* **X-axis:** "Grid Size (n)" - Scale ranges from 0 to 100, with tick marks every 10 units.
* **Y-axis:** "Number of Tiles" - Scale ranges from 0 to 120, with tick marks every 20 units.
* **Legend:** Located in the top-right corner.
* "AlphaEvolve's Score" - Represented by a blue line with triangular markers.
* "Optimal Score (n + [2√n] - 3)" - Represented by a dashed orange line.
* **Title:** Not explicitly present, but the chart's content implies a comparison of two scoring methods.
### Detailed Analysis
**AlphaEvolve's Score (Blue Line):**
The blue line generally slopes upward, indicating an increase in the number of tiles as the grid size increases. However, it exhibits significant fluctuations.
* At Grid Size (n) = 0, AlphaEvolve's Score is approximately 0 tiles.
* At Grid Size (n) = 10, AlphaEvolve's Score is approximately 12 tiles.
* At Grid Size (n) = 20, AlphaEvolve's Score is approximately 25 tiles.
* At Grid Size (n) = 30, AlphaEvolve's Score is approximately 38 tiles.
* At Grid Size (n) = 40, AlphaEvolve's Score is approximately 50 tiles.
* At Grid Size (n) = 50, AlphaEvolve's Score is approximately 62 tiles.
* At Grid Size (n) = 60, AlphaEvolve's Score is approximately 75 tiles, with a peak around 78 tiles.
* At Grid Size (n) = 70, AlphaEvolve's Score is approximately 88 tiles.
* At Grid Size (n) = 80, AlphaEvolve's Score is approximately 100 tiles, with a peak around 115 tiles.
* At Grid Size (n) = 90, AlphaEvolve's Score is approximately 110 tiles.
* At Grid Size (n) = 100, AlphaEvolve's Score is approximately 118 tiles.
**Optimal Score (Orange Dashed Line):**
The orange dashed line also slopes upward, representing a consistent increase in the number of tiles with increasing grid size. It is a smoother curve than the AlphaEvolve's Score.
* At Grid Size (n) = 0, Optimal Score is approximately 0 tiles.
* At Grid Size (n) = 10, Optimal Score is approximately 11 tiles.
* At Grid Size (n) = 20, Optimal Score is approximately 22 tiles.
* At Grid Size (n) = 30, Optimal Score is approximately 33 tiles.
* At Grid Size (n) = 40, Optimal Score is approximately 44 tiles.
* At Grid Size (n) = 50, Optimal Score is approximately 55 tiles.
* At Grid Size (n) = 60, Optimal Score is approximately 66 tiles.
* At Grid Size (n) = 70, Optimal Score is approximately 77 tiles.
* At Grid Size (n) = 80, Optimal Score is approximately 88 tiles.
* At Grid Size (n) = 90, Optimal Score is approximately 99 tiles.
* At Grid Size (n) = 100, Optimal Score is approximately 110 tiles.
### Key Observations
* AlphaEvolve's Score generally tracks the Optimal Score, but with more variability.
* AlphaEvolve's Score occasionally exceeds the Optimal Score, particularly between grid sizes of 60 and 100.
* The Optimal Score provides a theoretical upper bound or benchmark for performance.
* The formula for the Optimal Score is provided: "n + [2√n] - 3", where "[ ]" denotes the floor function.
### Interpretation
The chart demonstrates the performance of the AlphaEvolve algorithm in relation to a theoretically optimal solution for tiling a grid. The fluctuations in AlphaEvolve's Score suggest that the algorithm's performance is sensitive to the specific grid configuration or that it doesn't consistently achieve the optimal tiling. The periods where AlphaEvolve's Score surpasses the Optimal Score are interesting and could indicate instances where the algorithm discovers a tiling strategy that is unexpectedly efficient. The consistent upward trend of both lines confirms that as the grid size increases, the number of tiles required also increases, as expected. The difference between the two lines represents the performance gap between the algorithm and the theoretical optimum, highlighting potential areas for improvement in the AlphaEvolve algorithm. The formula provided for the Optimal Score allows for a quantitative comparison and evaluation of the algorithm's effectiveness.