## Line Graph: Comparison of AlphaEvolve's Score and Optimal Score
### Overview
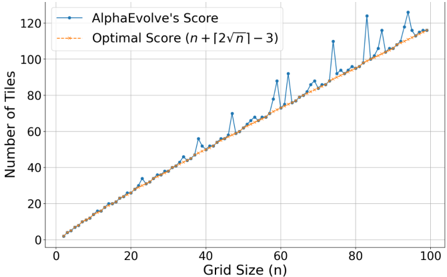
The image is a line graph comparing two metrics: "AlphaEvolve's Score" (blue line) and "Optimal Score" (orange dashed line) across varying grid sizes (n). The y-axis represents the "Number of Tiles," while the x-axis represents "Grid Size (n)" ranging from 0 to 100. The graph highlights the relationship between grid size and tile count for both metrics, with the Optimal Score defined by the formula $ n + \lfloor 2\sqrt{n} \rfloor - 3 $.
---
### Components/Axes
- **X-Axis (Grid Size, n)**: Labeled "Grid Size (n)" with values from 0 to 100 in increments of 20.
- **Y-Axis (Number of Tiles)**: Labeled "Number of Tiles" with values from 0 to 120 in increments of 20.
- **Legend**: Located in the top-left corner, with two entries:
- **Blue Solid Line**: "AlphaEvolve's Score"
- **Orange Dashed Line**: "Optimal Score ($ n + \lfloor 2\sqrt{n} \rfloor - 3 $)"
- **Formula**: The Optimal Score formula is explicitly written in the legend.
---
### Detailed Analysis
1. **AlphaEvolve's Score (Blue Line)**:
- Starts at (0, 0) and increases with grid size.
- Exhibits **spikes** at specific grid sizes (e.g., ~20, 40, 60, 80, 100), where the number of tiles jumps sharply (e.g., ~35 at n=20, ~70 at n=60, ~110 at n=100).
- Shows **volatility**, with peaks and troughs deviating from the Optimal Score.
2. **Optimal Score (Orange Dashed Line)**:
- Follows a **smooth, steady upward trend** with minimal fluctuations.
- Aligns closely with the formula $ n + \lfloor 2\sqrt{n} \rfloor - 3 $, which predicts a sublinear growth rate due to the $ \sqrt{n} $ term.
- At n=100, the Optimal Score reaches ~115 tiles.
3. **Key Data Points**:
- At n=0: Both scores start at 0.
- At n=20: AlphaEvolve's Score ~35 vs. Optimal ~37.
- At n=40: AlphaEvolve's Score ~55 vs. Optimal ~60.
- At n=60: AlphaEvolve's Score ~70 vs. Optimal ~75.
- At n=80: AlphaEvolve's Score ~95 vs. Optimal ~100.
- At n=100: AlphaEvolve's Score ~110 vs. Optimal ~115.
---
### Key Observations
- **Alignment**: Both lines start at the origin and generally trend upward, but AlphaEvolve's Score lags slightly behind the Optimal Score.
- **Spikes**: AlphaEvolve's Score exhibits abrupt increases at specific grid sizes, suggesting non-linear or algorithmic behavior.
- **Formula Validation**: The Optimal Score formula matches the orange dashed line's trajectory, confirming its theoretical basis.
- **Volatility**: AlphaEvolve's Score shows irregularities, indicating potential inefficiencies or variability in its performance.
---
### Interpretation
The graph demonstrates that AlphaEvolve's Score approximates the Optimal Score but with notable deviations. The Optimal Score's formula ($ n + \lfloor 2\sqrt{n} \rfloor - 3 $) suggests a theoretical minimum tile count based on grid size, growing sublinearly due to the $ \sqrt{n} $ term. AlphaEvolve's Score, while close to this target, shows spikes and dips, implying:
1. **Efficiency Variability**: The algorithm may perform optimally at certain grid sizes but struggles at others.
2. **Theoretical vs. Practical**: The Optimal Score represents an idealized benchmark, while AlphaEvolve's Score reflects real-world performance with inherent fluctuations.
3. **Scalability**: Both metrics scale with grid size, but AlphaEvolve's Score may require optimization to reduce volatility and better match the theoretical model.
The data underscores the importance of balancing theoretical efficiency with practical adaptability in algorithmic design.