\n
## Bar Chart: F1 Score vs. Number of Retrieval Questions
### Overview
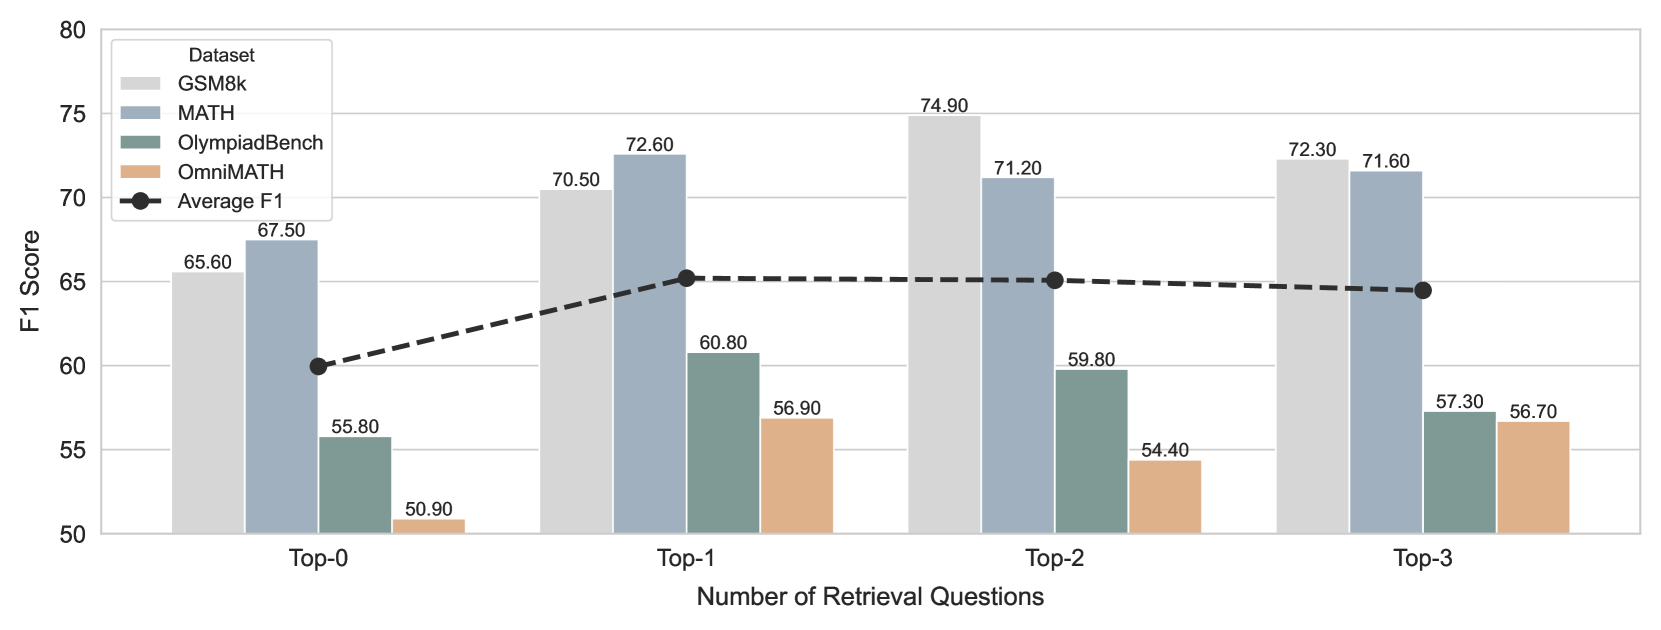
This bar chart compares the F1 scores of four datasets (GSM8k, MATH, OlympiadBench, and OmniMATH) across different numbers of retrieval questions (Top-0, Top-1, Top-2, and Top-3). A black dashed line represents the average F1 score across all datasets. The chart visually demonstrates how performance changes as the number of retrieved questions increases.
### Components/Axes
* **X-axis:** Number of Retrieval Questions (Top-0, Top-1, Top-2, Top-3)
* **Y-axis:** F1 Score (ranging from 50 to 80)
* **Legend (Top-right):**
* GSM8k (Light Gray)
* MATH (Gray)
* OlympiadBench (Teal)
* OmniMATH (Orange)
* Average F1 (Black, dashed line with diamond markers)
### Detailed Analysis
The chart consists of grouped bar plots for each dataset at each retrieval question level, along with a line plot representing the average F1 score.
* **Top-0:**
* GSM8k: Approximately 65.60
* MATH: Approximately 55.80
* OlympiadBench: Approximately 50.90
* OmniMATH: Approximately 67.50
* Average F1: Approximately 58.20
* **Top-1:**
* GSM8k: Approximately 72.60
* MATH: Approximately 60.80
* OlympiadBench: Approximately 56.90
* OmniMATH: Approximately 70.50
* Average F1: Approximately 65.20
* **Top-2:**
* GSM8k: Approximately 74.90
* MATH: Approximately 59.80
* OlympiadBench: Approximately 54.40
* OmniMATH: Approximately 71.20
* Average F1: Approximately 65.10
* **Top-3:**
* GSM8k: Approximately 72.30
* MATH: Approximately 57.30
* OlympiadBench: Approximately 56.70
* OmniMATH: Approximately 71.60
* Average F1: Approximately 64.50
**Trends:**
* The Average F1 score initially increases from Top-0 to Top-1, then plateaus between Top-1 and Top-3. The line slopes upward from approximately 58.20 to 65.20, then remains relatively flat.
* GSM8k consistently exhibits the highest F1 scores across all retrieval question levels.
* MATH generally has lower F1 scores compared to GSM8k and OmniMATH.
* OlympiadBench consistently has the lowest F1 scores.
* OmniMATH shows a significant increase in F1 score from Top-0 to Top-1, and then a slight decrease from Top-1 to Top-3.
### Key Observations
* Retrieving even a single question (Top-1) significantly improves the average F1 score.
* The benefit of adding more retrieved questions diminishes after the first question (Top-1).
* GSM8k is the most robust dataset, showing consistent high performance.
* OlympiadBench is the most challenging dataset, with consistently low performance.
### Interpretation
The data suggests that retrieving a small number of relevant questions can substantially improve the performance of a model on these math datasets. However, there's a diminishing return to scale; adding more questions beyond the first few doesn't lead to significant further improvements. This could indicate that the initial retrieval step is the most critical, and subsequent questions provide only marginal benefit. The differences in performance between the datasets highlight the varying difficulty levels of the problems within each dataset. GSM8k's consistently high scores suggest it contains relatively simpler problems, while OlympiadBench's low scores indicate it presents more challenging problems. The plateauing of the average F1 score suggests that the model's ability to utilize additional retrieved information is limited, potentially due to factors like the quality of the retrieved questions or the model's capacity to process them effectively.