## Grouped Bar Chart with Line Overlay: F1 Score by Number of Retrieval Questions
### Overview
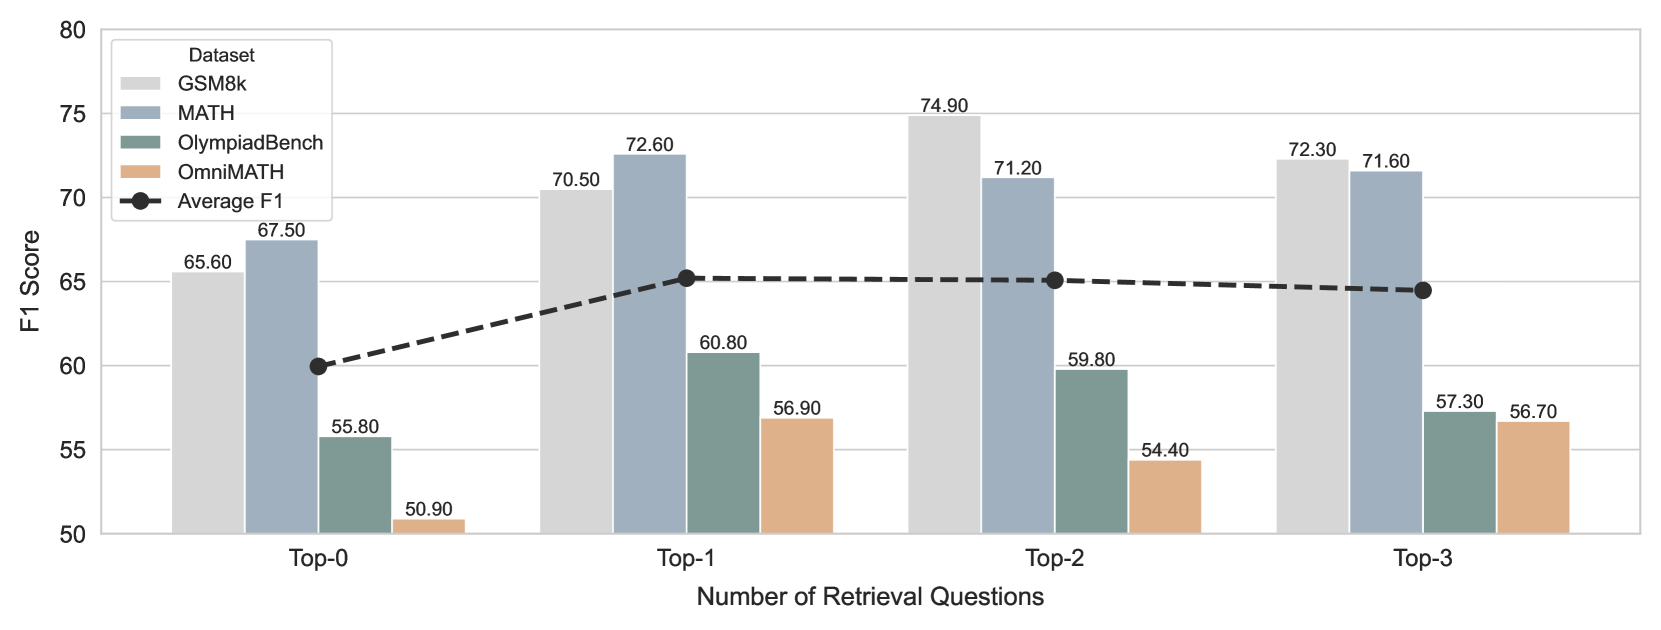
The image displays a grouped bar chart with an overlaid line graph. It compares the F1 Score performance of four different datasets across four categories representing the "Number of Retrieval Questions" (Top-0, Top-1, Top-2, Top-3). An "Average F1" trend line is superimposed on the chart.
### Components/Axes
* **Chart Type:** Grouped bar chart with a line graph overlay.
* **X-Axis:** Labeled "Number of Retrieval Questions". It has four categorical groups: `Top-0`, `Top-1`, `Top-2`, and `Top-3`.
* **Y-Axis:** Labeled "F1 Score". The scale runs from 50 to 80, with major gridlines at intervals of 5.
* **Legend:** Located in the top-left corner of the chart area. It defines the following series:
* **GSM8k:** Light gray bar.
* **MATH:** Blue-gray bar.
* **OlympiadBench:** Teal/green-gray bar.
* **OmniMATH:** Tan/light brown bar.
* **Average F1:** Black dashed line with circular markers.
* **Data Labels:** Numerical F1 Score values are printed directly above each bar.
### Detailed Analysis
**Data Series and Values (by X-Axis Category):**
1. **Top-0:**
* GSM8k (Light Gray): 65.60
* MATH (Blue-Gray): 67.50
* OlympiadBench (Teal): 55.80
* OmniMATH (Tan): 50.90
* *Average F1 (Black Line Marker):* Positioned at 60.00.
2. **Top-1:**
* GSM8k (Light Gray): 70.50
* MATH (Blue-Gray): 72.60
* OlympiadBench (Teal): 60.80
* OmniMATH (Tan): 56.90
* *Average F1 (Black Line Marker):* Positioned at 65.00.
3. **Top-2:**
* GSM8k (Light Gray): 74.90
* MATH (Blue-Gray): 71.20
* OlympiadBench (Teal): 59.80
* OmniMATH (Tan): 54.40
* *Average F1 (Black Line Marker):* Positioned at 65.00.
4. **Top-3:**
* GSM8k (Light Gray): 72.30
* MATH (Blue-Gray): 71.60
* OlympiadBench (Teal): 57.30
* OmniMATH (Tan): 56.70
* *Average F1 (Black Line Marker):* Positioned at approximately 64.50.
**Trend Verification (Visual Description):**
* **GSM8k (Light Gray):** The bar height increases from Top-0 to Top-2, reaching a peak, then shows a slight decrease at Top-3.
* **MATH (Blue-Gray):** The bar height increases from Top-0 to Top-1, then shows a gradual decrease through Top-2 and Top-3.
* **OlympiadBench (Teal):** The bar height increases from Top-0 to Top-1, then decreases at Top-2 and further at Top-3.
* **OmniMATH (Tan):** The bar height increases from Top-0 to Top-1, decreases at Top-2, and then increases again at Top-3.
* **Average F1 (Black Dashed Line):** The line shows a clear upward slope from Top-0 to Top-1, then plateaus horizontally to Top-2, followed by a very slight downward slope to Top-3.
### Key Observations
1. **Performance Hierarchy:** Across all categories, the `GSM8k` and `MATH` datasets consistently achieve higher F1 Scores (generally above 65) compared to `OlympiadBench` and `OmniMATH` (generally below 61).
2. **Peak Performance:** The highest individual F1 Score recorded is 74.90 for `GSM8k` at `Top-2`. The highest score for `MATH` is 72.60 at `Top-1`.
3. **Average Trend:** The "Average F1" line indicates that, on average, performance improves significantly when moving from no retrieval (`Top-0`) to one retrieval question (`Top-1`). The average performance then stabilizes between `Top-1` and `Top-2` before a marginal decline at `Top-3`.
4. **Dataset-Specific Patterns:** `GSM8k` shows the most pronounced benefit from retrieval, peaking at `Top-2`. `MATH` peaks earlier at `Top-1`. `OmniMATH` shows a non-linear pattern, dipping at `Top-2` before recovering at `Top-3`.
### Interpretation
This chart demonstrates the impact of incorporating retrieved information (quantified by the number of retrieval questions) on model performance across different mathematical reasoning benchmarks. The data suggests a clear, positive effect of retrieval, with the most substantial gain occurring with the introduction of the first retrieval question (`Top-0` to `Top-1`). The plateau in the average score from `Top-1` to `Top-2` implies diminishing returns; adding a second retrieval question does not yield a significant average improvement. The slight average decline at `Top-3` could indicate potential noise or interference from too much retrieved context, though the effect is small.
The variance in optimal points across datasets (`GSM8k` at `Top-2`, `MATH` at `Top-1`) highlights that the ideal amount of retrieval may be task or dataset-dependent. The consistently lower scores for `OlympiadBench` and `OmniMATH` suggest these benchmarks present a greater challenge for the evaluated system, regardless of the retrieval configuration. Overall, the visualization argues for the strategic use of retrieval in mathematical problem-solving, with a recommendation to consider 1 or 2 retrieval questions as a potentially optimal range for balancing performance and complexity.