## Bar Chart: F1 Score Comparison Across Datasets and Retrieval Question Numbers
### Overview
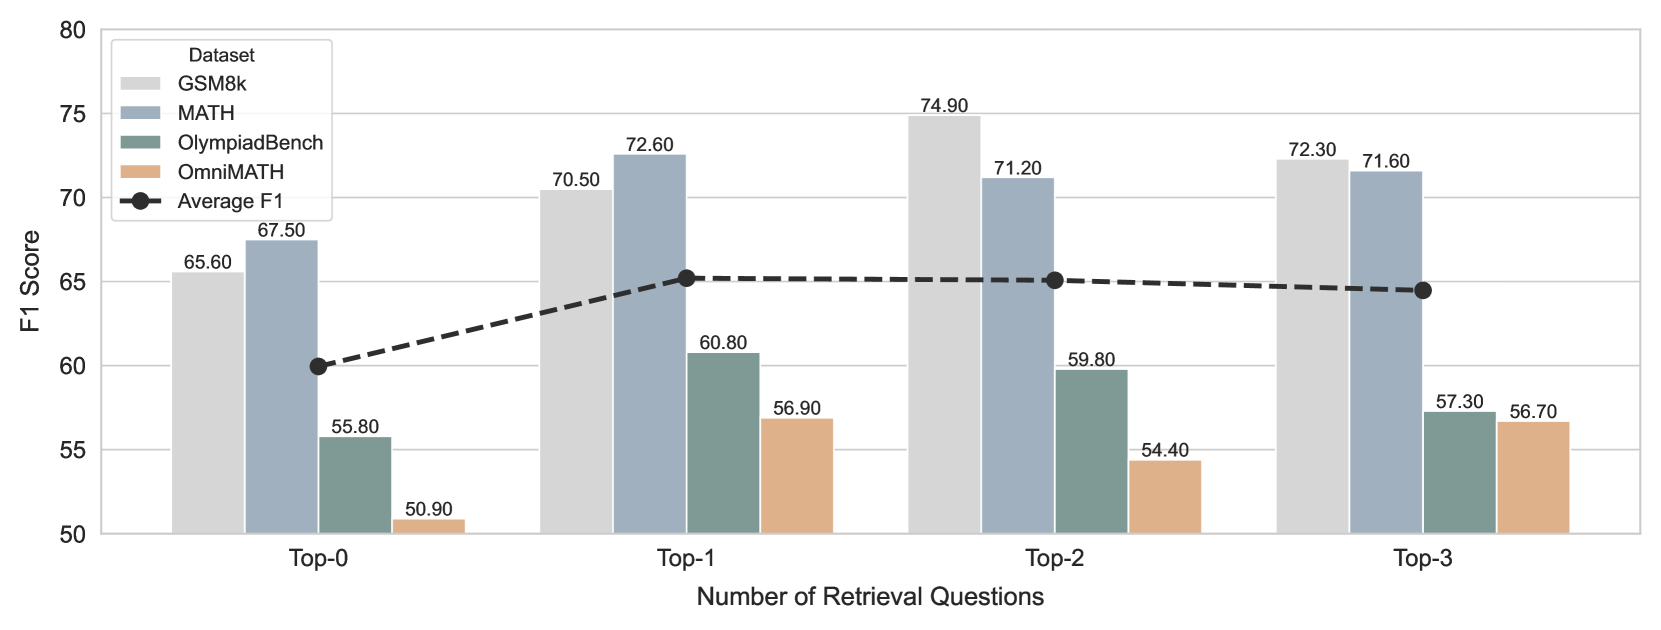
The chart compares F1 scores for four datasets (GSM8k, MATH, OlympiadBench, OmniMATH) across four retrieval question thresholds (Top-0 to Top-3). A dashed black line represents the average F1 score across all datasets. Bars are color-coded per dataset, with numerical values labeled on top of each bar.
### Components/Axes
- **X-axis**: "Number of Retrieval Questions" with categories: Top-0, Top-1, Top-2, Top-3.
- **Y-axis**: "F1 Score" scaled from 50 to 80 in increments of 5.
- **Legend**: Located in the top-right corner, mapping colors to datasets:
- Gray: GSM8k
- Blue: MATH
- Teal: OlympiadBench
- Orange: OmniMATH
- Black circle: Average F1 (dashed line).
- **Axis Markers**: Y-axis gridlines at every 5-point interval; X-axis labels centered below categories.
### Detailed Analysis
#### Dataset Performance by Retrieval Threshold
- **Top-0**:
- GSM8k: 65.60
- MATH: 67.50
- OlympiadBench: 55.80
- OmniMATH: 50.90
- Average F1: 60.00 (dashed line)
- **Top-1**:
- GSM8k: 70.50
- MATH: 72.60
- OlympiadBench: 60.80
- OmniMATH: 56.90
- Average F1: 65.20
- **Top-2**:
- GSM8k: 74.90
- MATH: 71.20
- OlympiadBench: 59.80
- OmniMATH: 54.40
- Average F1: 65.00
- **Top-3**:
- GSM8k: 72.30
- MATH: 71.60
- OlympiadBench: 57.30
- OmniMATH: 56.70
- Average F1: 64.50
#### Trends
- **GSM8k**: Shows a consistent upward trend (65.60 → 74.90) until Top-2, then a slight decline at Top-3.
- **MATH**: Peaks at Top-1 (72.60), then declines steadily (71.20 → 71.60).
- **OlympiadBench**: Gradual improvement (55.80 → 57.30) across all thresholds.
- **OmniMATH**: Slight improvement (50.90 → 56.70) but remains the lowest performer.
- **Average F1**: Peaks at Top-1 (65.20), then declines slightly (65.00 → 64.50).
### Key Observations
1. **MATH** achieves the highest F1 score at Top-1 (72.60) but underperforms relative to GSM8k at Top-2 and Top-3.
2. **GSM8k** demonstrates the strongest overall improvement with increased retrieval questions, reaching 74.90 at Top-2.
3. **OlympiadBench** and **OmniMATH** lag significantly behind other datasets, with OmniMATH showing the lowest scores across all thresholds.
4. The average F1 score plateaus after Top-1, suggesting diminishing returns for additional retrieval questions beyond this point.
### Interpretation
The data suggests that increasing the number of retrieval questions improves performance for most datasets, with **GSM8k** benefiting the most. However, the average F1 score plateaus after Top-1, indicating that further retrieval questions may not yield proportional gains. **MATH**'s decline after Top-1 could imply over-reliance on retrieval at higher thresholds, while **OlympiadBench** and **OmniMATH** require targeted improvements to close the performance gap. The trend highlights a trade-off between retrieval depth and practical utility, as gains beyond Top-1 become marginal for the average case.