## Chart: C(S(3,l)) vs. l
### Overview
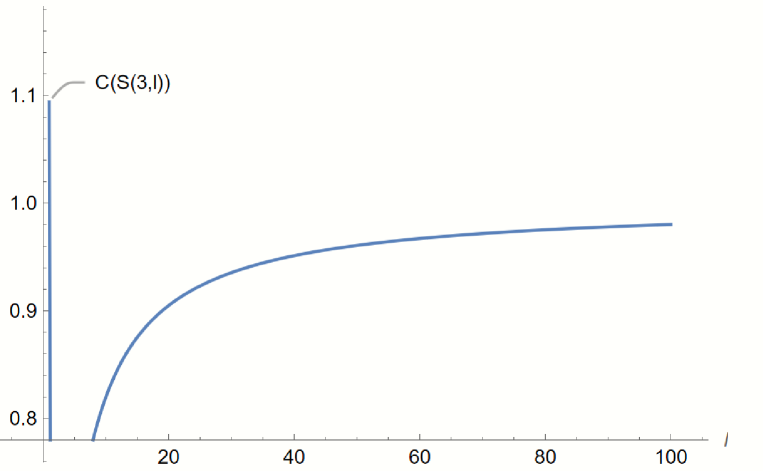
The image is a 2D line chart showing the relationship between a function C(S(3,l)) and the variable 'l'. The chart displays a curve that starts near 0.8 on the y-axis, rises sharply, and then gradually approaches a value near 0.98 as 'l' increases to 100.
### Components/Axes
* **X-axis (Horizontal):** Labeled as 'l'. The axis ranges from approximately 0 to 100, with tick marks at intervals of 20 (20, 40, 60, 80, 100).
* **Y-axis (Vertical):** Ranges from 0.8 to 1.1, with tick marks at intervals of 0.1 (0.8, 0.9, 1.0, 1.1).
* **Curve:** A blue line representing the function C(S(3,l)).
* **Label:** "C(S(3,l))" is positioned near the top-left of the chart, next to the curve's initial vertical segment.
### Detailed Analysis
* **Initial Behavior:** The curve starts at approximately l=5 and C(S(3,l)) = 0.78. It rises almost vertically to approximately C(S(3,l)) = 1.1 at l=5.
* **Rising Phase:** From l=5 to l=40, the curve rises rapidly but with decreasing slope.
* **Asymptotic Behavior:** Beyond l=40, the curve continues to rise, but at a much slower rate, approaching an asymptotic value. At l=100, C(S(3,l)) is approximately 0.98.
### Key Observations
* The function C(S(3,l)) exhibits a rapid increase for small values of 'l' and then gradually approaches a limit as 'l' increases.
* The initial vertical segment of the curve is notable.
### Interpretation
The chart illustrates a function C(S(3,l)) that is highly sensitive to small values of 'l'. The function quickly reaches a significant portion of its maximum value and then slowly converges towards a limit as 'l' becomes large. This behavior suggests that 'l' has a diminishing effect on C(S(3,l)) as 'l' increases. The function might represent a physical or mathematical relationship where the initial impact of 'l' is substantial, but its influence wanes as 'l' grows.