\n
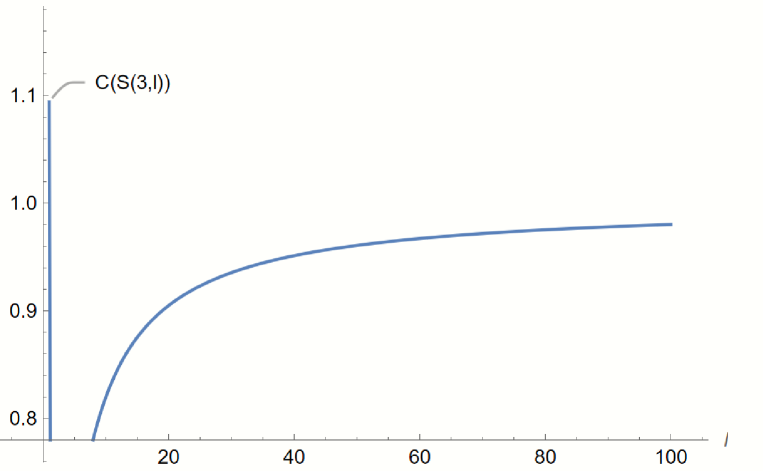
## Chart: Function Plot - C(S(3,l))
### Overview
The image displays a plot of a function, labeled as C(S(3,l)), against an unnamed variable represented on the x-axis. The y-axis represents values ranging from approximately 0.8 to 1.1. The plot shows a curve that initially increases rapidly and then plateaus, approaching a horizontal asymptote.
### Components/Axes
* **X-axis:** Unlabeled, ranging from approximately 0 to 100. The axis is marked with tick marks at intervals of 10.
* **Y-axis:** Unlabeled, ranging from approximately 0.8 to 1.1. The axis is marked with tick marks at intervals of 0.1.
* **Curve:** A single blue line representing the function C(S(3,l)).
* **Label:** "C(S(3,l))" positioned at the top-left of the curve, indicating the function being plotted.
### Detailed Analysis
The curve starts at approximately y = 0.8 when x is near 0. It increases sharply until approximately x = 20, reaching a value of around y = 0.92. From x = 20 to x = 60, the curve continues to increase, but at a decreasing rate, reaching a maximum value of approximately y = 0.98 at x = 60. Beyond x = 60, the curve flattens out and approaches a horizontal asymptote around y = 0.99. At x = 100, the curve is at approximately y = 0.995.
Here's a reconstruction of approximate data points:
| X (approx.) | Y (approx.) |
|---|---|
| 0 | 0.8 |
| 10 | 0.88 |
| 20 | 0.92 |
| 30 | 0.95 |
| 40 | 0.965 |
| 50 | 0.975 |
| 60 | 0.98 |
| 70 | 0.985 |
| 80 | 0.99 |
| 90 | 0.992 |
| 100 | 0.995 |
### Key Observations
The function exhibits diminishing returns. The initial increase is substantial, but the rate of increase slows down significantly as the x-value increases. The curve appears to be approaching a limit, suggesting a saturation effect.
### Interpretation
The plot likely represents a function where the output (y-axis) is influenced by an input (x-axis), but with a decreasing marginal effect. The function C(S(3,l)) could model a system where increasing the input 'l' initially yields significant gains, but eventually, the gains become smaller and smaller, approaching a maximum capacity or limit. The 'S(3,l)' part of the function suggests a possible relationship involving a parameter '3' and the input 'l', potentially within a specific mathematical or physical context. Without further information about the context of this function, it's difficult to provide a more specific interpretation. The shape of the curve is characteristic of functions like logarithmic or hyperbolic functions, which often describe saturation phenomena.