## Line Graph: C(S(3,I)) vs I
### Overview
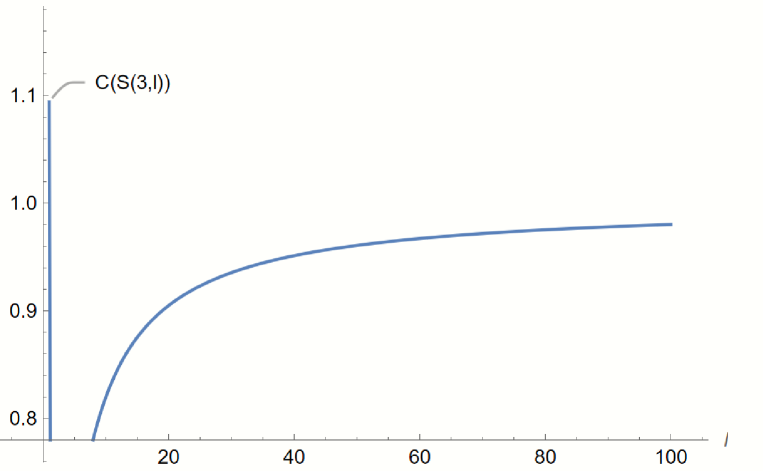
The image depicts a line graph illustrating the relationship between a variable labeled "I" (x-axis) and a function "C(S(3,I))" (y-axis). The graph shows a decreasing trend in "C(S(3,I))" as "I" increases, with a sharp vertical segment at the origin.
### Components/Axes
- **X-axis**: Labeled "I", scaled from 0 to 100 in increments of 20.
- **Y-axis**: Labeled "C(S(3,I))", scaled from 0.8 to 1.1 in increments of 0.1.
- **Legend**: Located at the top-right corner, indicating the line represents "C(S(3,I))" in blue.
- **Line**: A single blue curve starting at (0, 1.1), curving downward, and approaching a horizontal asymptote near y = 0.95 as x increases.
### Detailed Analysis
- **Vertical Segment**: At x = 0, the line extends vertically from y = 0.8 to y = 1.1.
- **Curve Behavior**: The curve decreases sharply initially, then flattens as x increases. Key approximate points:
- At x = 0: y = 1.1 (peak).
- At x = 20: y ≈ 0.92.
- At x = 40: y ≈ 0.94.
- At x = 60: y ≈ 0.95.
- At x = 80: y ≈ 0.96.
- At x = 100: y ≈ 0.97.
### Key Observations
- The function "C(S(3,I))" exhibits a **saturation effect**, where its value decreases rapidly at low "I" and stabilizes near 0.95–0.97 for higher "I".
- The vertical segment at x = 0 suggests a discontinuity or undefined behavior at the origin.
### Interpretation
The graph likely models a system where "C(S(3,I))" represents a capacity, efficiency, or probability metric that diminishes as "I" (possibly an input or intensity parameter) increases. The saturation behavior implies diminishing returns or a limiting factor in the system. The vertical segment at x = 0 may indicate an initial condition or boundary condition where the function is undefined or capped. The trend aligns with models where variables approach an asymptotic limit under increasing inputs.