## Line Chart: Dead Features over Training Steps
### Overview
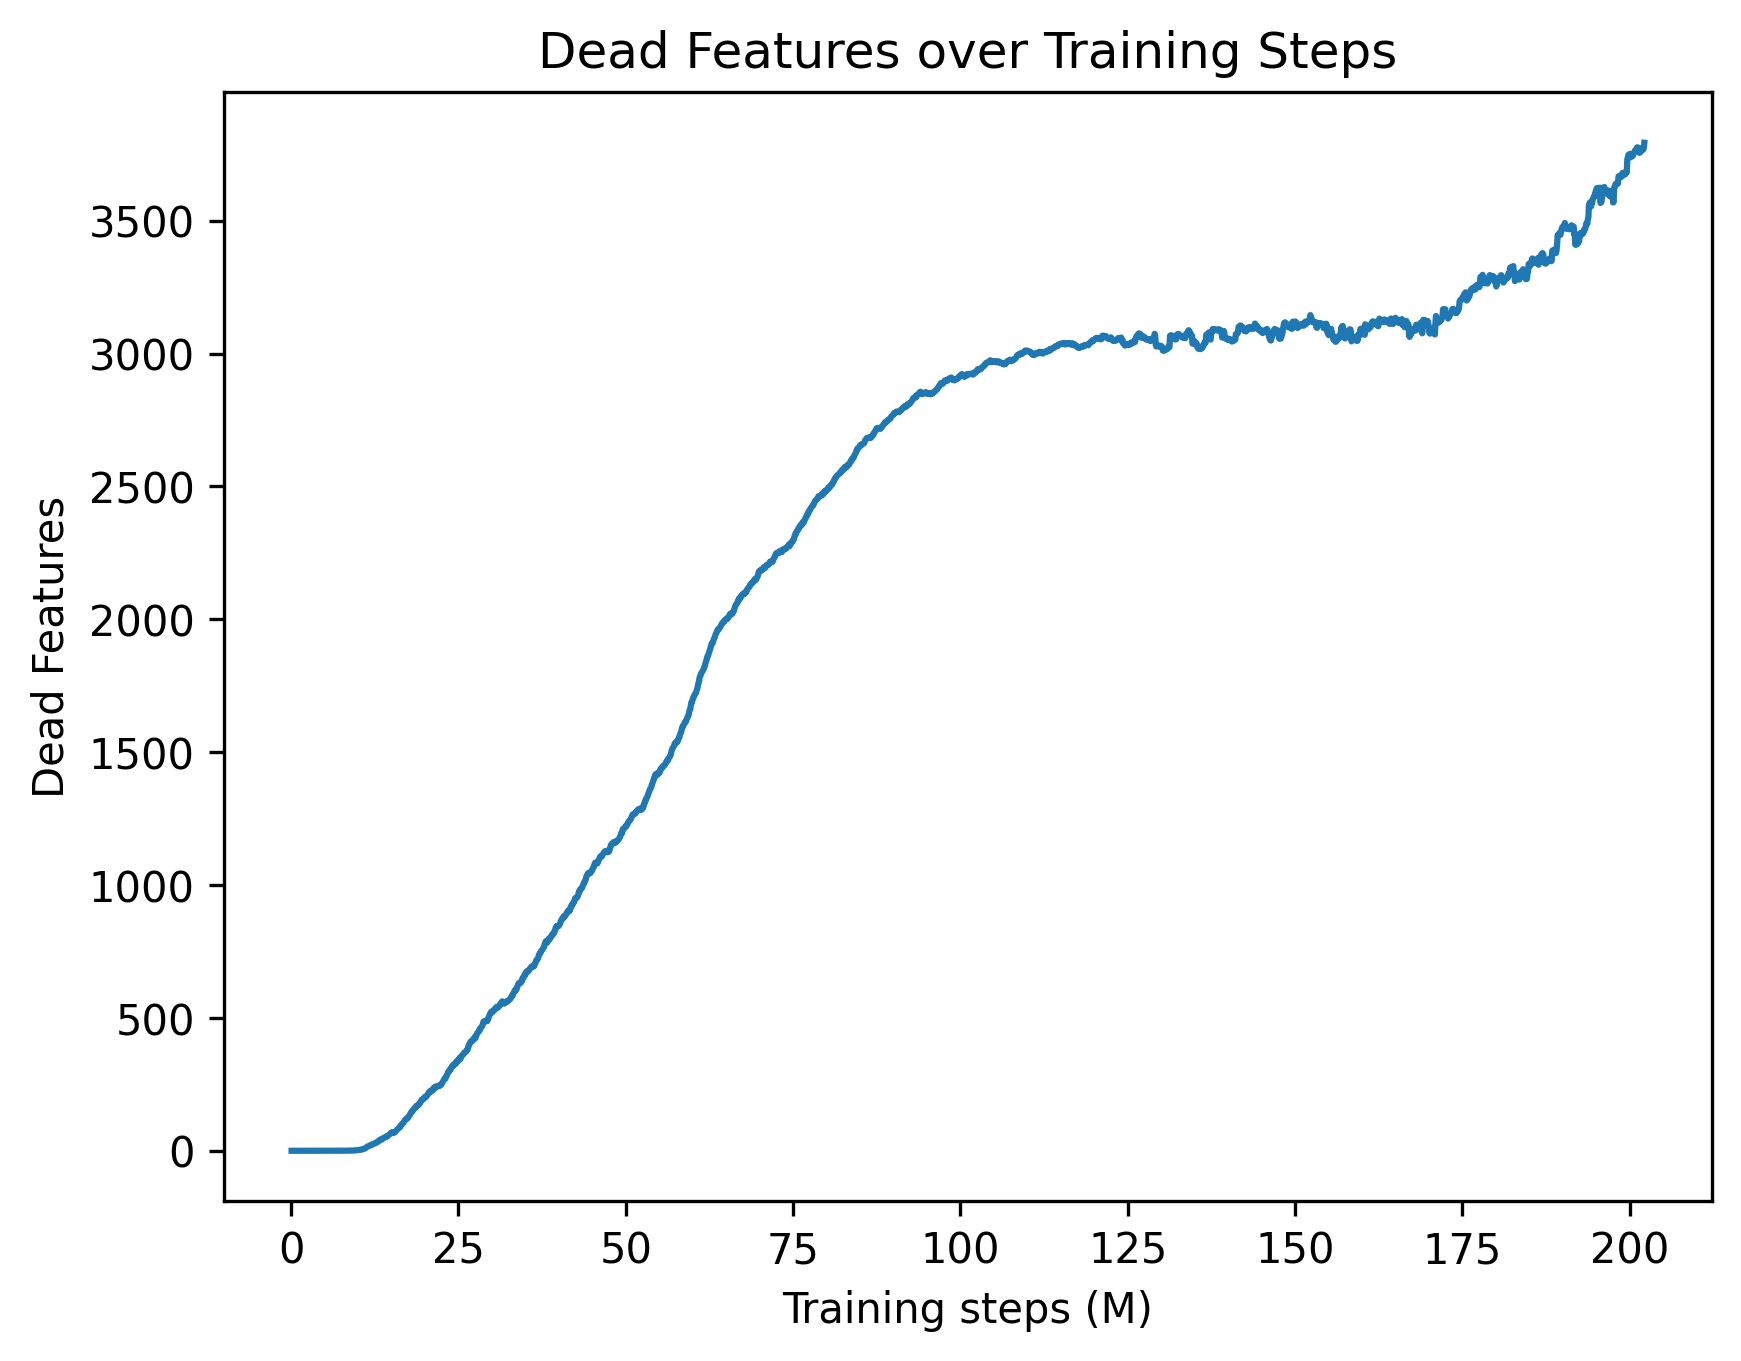
This image is a 2D line chart illustrating the accumulation of "dead features" within a machine learning model over the course of its training process. The chart tracks a single metric (represented by a blue line) across millions of training steps, showing distinct phases of stability, rapid growth, plateauing, and secondary growth.
### Components/Axes
The image can be isolated into the following spatial components:
* **Header Region (Top Center):** Contains the chart title: `Dead Features over Training Steps`.
* **X-Axis (Bottom Region):**
* **Label:** `Training steps (M)` (Centered below the axis). The "(M)" indicates the unit is in millions.
* **Scale:** Linear scale starting at 0 and extending slightly past 200.
* **Markers:** Major tick marks are placed at intervals of 25: `0`, `25`, `50`, `75`, `100`, `125`, `150`, `175`, `200`.
* **Y-Axis (Left Region):**
* **Label:** `Dead Features` (Rotated 90 degrees counter-clockwise, centered vertically).
* **Scale:** Linear scale starting at 0 and extending to 3500 (with the plot area allowing for values up to approximately 3900).
* **Markers:** Major tick marks are placed at intervals of 500: `0`, `500`, `1000`, `1500`, `2000`, `2500`, `3000`, `3500`.
* **Main Chart Area (Center):** Contains a single, solid blue line representing the data series. There is no legend as there is only one data series.
### Detailed Analysis
**Trend Verification and Data Extraction:**
The single blue line exhibits four distinct behavioral phases. Below is the visual trend followed by approximate data points (with an uncertainty of ±50 on the Y-axis and ±2 on the X-axis).
1. **Initial Dormancy (Flatline):** The line begins at the origin and remains perfectly flat, sloping neither up nor down.
* At X = 0 M, Y = 0
* At X ≈ 12 M, Y = 0
2. **Rapid Accumulation (Steep Upward Slope):** Starting around 12M steps, the line slopes upward steeply. The slope is relatively consistent but contains minor, high-frequency jitter.
* At X = 25 M, Y ≈ 250
* At X = 50 M, Y ≈ 1200
* At X = 75 M, Y ≈ 2300
* At X = 100 M, Y ≈ 2900
3. **Equilibrium Plateau (Flat but Noisy):** Between 100M and 170M steps, the upward slope ceases. The line becomes horizontal but exhibits continuous, jagged, high-frequency noise.
* At X = 125 M, Y ≈ 3050
* At X = 150 M, Y ≈ 3100
* At X = 170 M, Y ≈ 3100
4. **Secondary Accumulation (Resumed Upward Slope):** After 170M steps, the line breaks the plateau and begins sloping upward steeply again, maintaining the jagged noise profile.
* At X = 175 M, Y ≈ 3200
* At X = 200 M, Y ≈ 3600
* At X ≈ 202 M (End of chart), Y ≈ 3800
### Key Observations
* **Delayed Onset:** The phenomenon of "dead features" does not begin immediately; there is a grace period of roughly 12 million steps where all features remain active.
* **High-Frequency Noise:** Once the rapid accumulation phase ends (around 100M steps), the line is no longer smooth. The constant jitter suggests that features might be dying and occasionally reviving, or the metric is highly sensitive to batch-to-batch variance.
* **Anomalous Late-Stage Rise:** The most notable visual anomaly is the secondary spike starting at 170M steps. After 70 million steps of stability, a sudden change causes features to begin dying again at a rapid pace.
### Interpretation
* **What the data suggests:** In neural network training (particularly in models using ReLU activations or Sparse Autoencoders), a "dead feature" or "dead neuron" is one that ceases to activate for any input in the dataset, effectively contributing nothing to the model's output. This chart tracks the loss of model capacity over time. Out of an unknown total number of features, nearly 3,800 have died by the end of the run.
* **Relational Dynamics:** The initial flatline suggests that early in training, the initialization parameters or high learning rates keep all neurons active. As the model begins to learn and optimize (12M to 100M steps), it aggressively prunes or abandons certain representations, leading to a massive die-off of features. The plateau (100M to 170M) indicates the model reached a stable representational state where the active capacity was sufficient for the task.
* **Reading between the lines (Peircean Investigative):** The sudden secondary rise at 170M steps is highly indicative of an external intervention in the training hyperparameters. In standard training runs, if a plateau is reached, it usually remains flat. A sudden spike late in training strongly implies a **Learning Rate Decay** schedule kicked in (e.g., a step decay or cosine annealing reaching its minimum). When the learning rate drops significantly, the model settles into sharper local minima, which often causes a secondary wave of neurons to die off because they no longer receive large enough gradient updates to stay active. Alternatively, this could represent a shift in the training data curriculum at the 170M step mark.