## Line Chart: Dead Features over Training Steps
### Overview
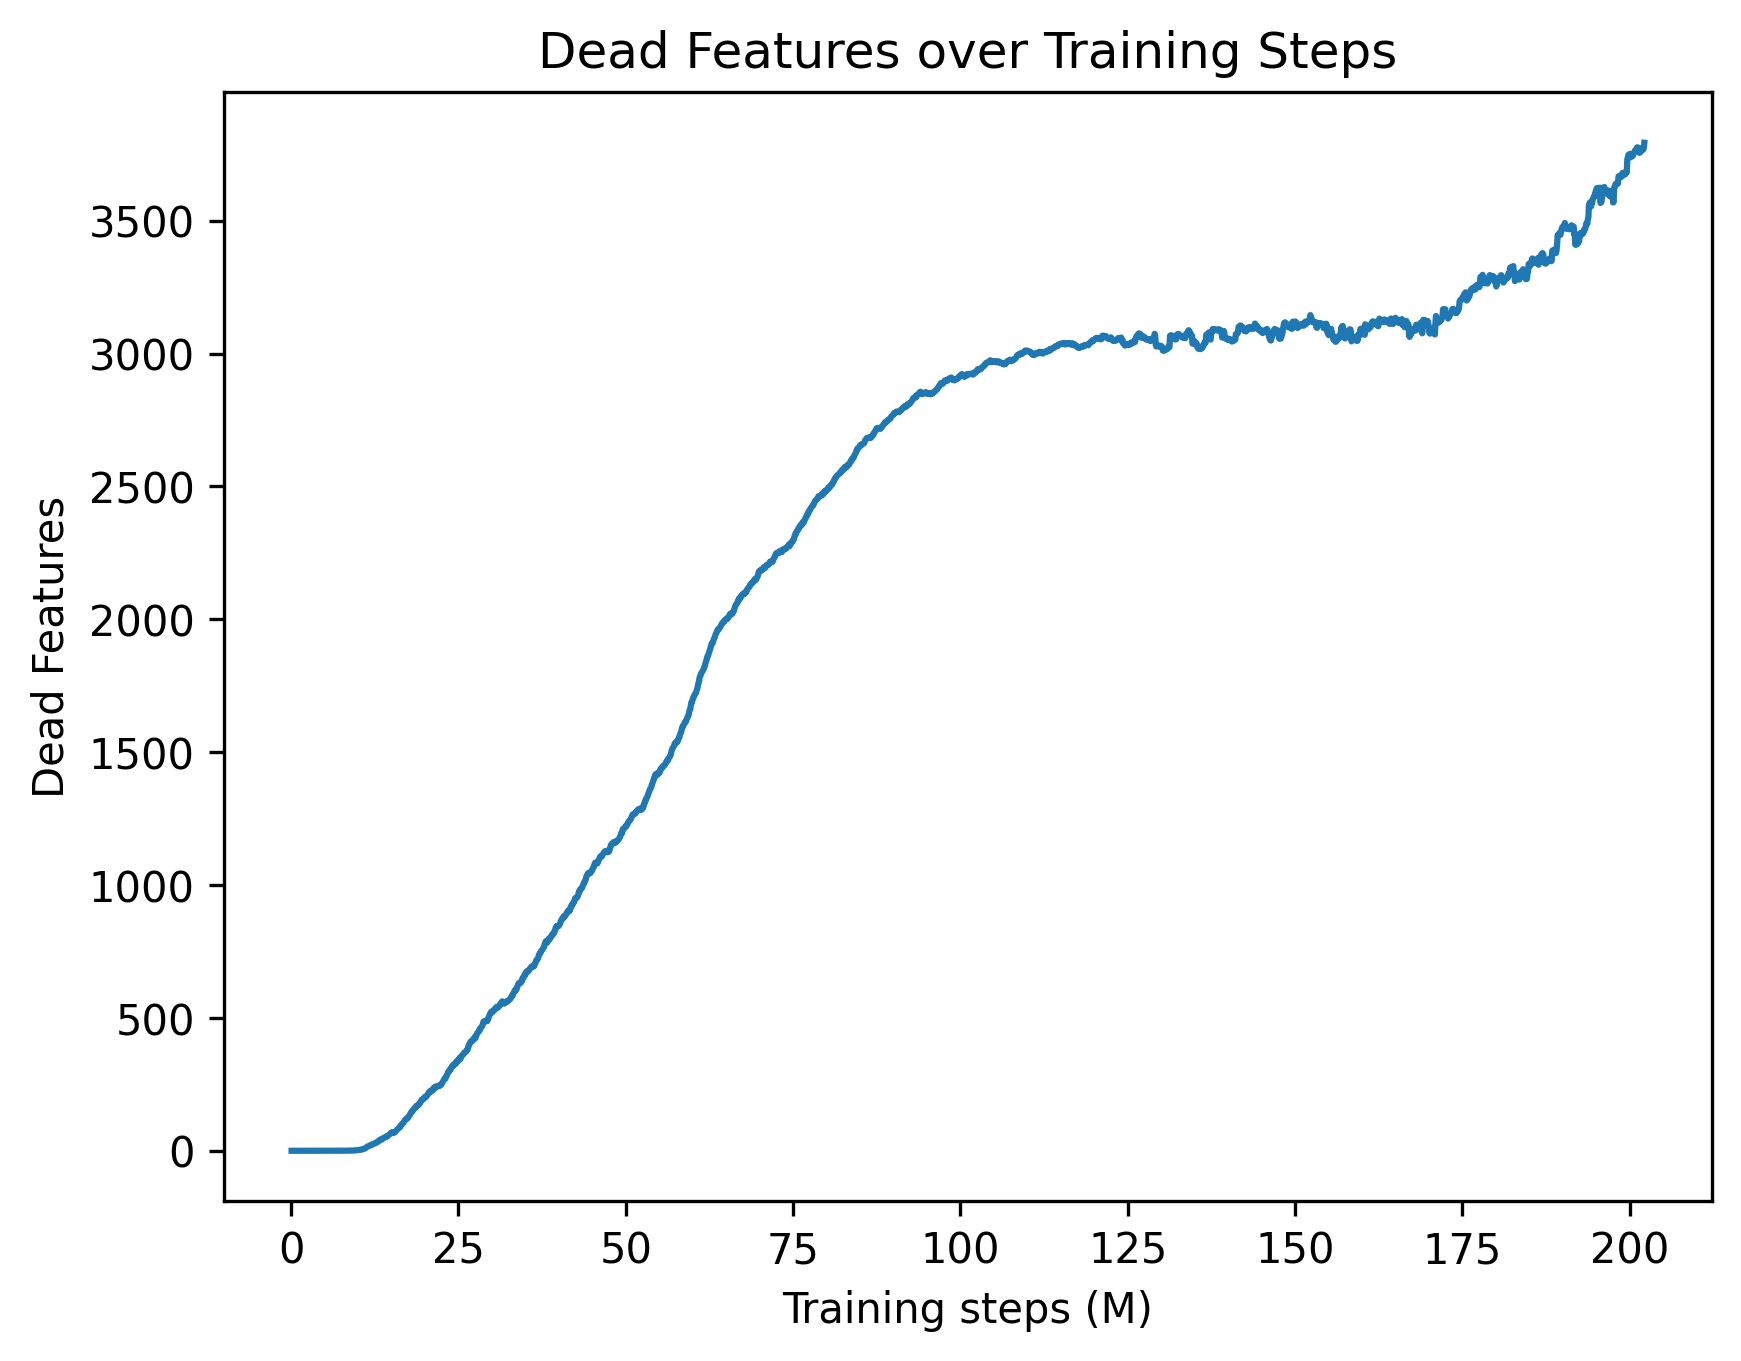
The image is a line chart that plots the number of "Dead Features" against "Training steps (M)". The chart illustrates how the number of dead features changes as the training progresses. The line starts near zero, increases rapidly, plateaus, and then increases again towards the end.
### Components/Axes
* **Title:** Dead Features over Training Steps
* **X-axis:** Training steps (M)
* Scale: 0 to 200, with tick marks at intervals of 25 (0, 25, 50, 75, 100, 125, 150, 175, 200)
* **Y-axis:** Dead Features
* Scale: 0 to 3500, with tick marks at intervals of 500 (0, 500, 1000, 1500, 2000, 2500, 3000, 3500)
* **Data Series:** One data series represented by a blue line.
### Detailed Analysis
* **Blue Line (Dead Features):**
* **Trend:** The line initially starts at approximately 0. It then increases rapidly between 0 and 75 training steps. The rate of increase slows down between 75 and 125 training steps, forming a plateau. After 150 training steps, the line begins to increase again, reaching approximately 3800 at 200 training steps.
* **Data Points (Approximate):**
* 0 Training Steps: ~0 Dead Features
* 25 Training Steps: ~200 Dead Features
* 50 Training Steps: ~1200 Dead Features
* 75 Training Steps: ~2400 Dead Features
* 100 Training Steps: ~2900 Dead Features
* 125 Training Steps: ~3050 Dead Features
* 150 Training Steps: ~3080 Dead Features
* 175 Training Steps: ~3400 Dead Features
* 200 Training Steps: ~3800 Dead Features
### Key Observations
* The number of dead features increases significantly during the initial training phase.
* The increase in dead features slows down and plateaus around 125 training steps.
* The number of dead features increases again towards the end of the training process.
### Interpretation
The chart suggests that as the model trains, an increasing number of features become "dead" or non-contributing. The initial rapid increase indicates a quick adaptation phase where many features are discarded. The plateau suggests a period of stabilization. The final increase could indicate overfitting or further refinement where some features become redundant. The overall trend highlights the dynamic nature of feature usage during the training process.