## Line Chart: Dead Features over Training Steps
### Overview
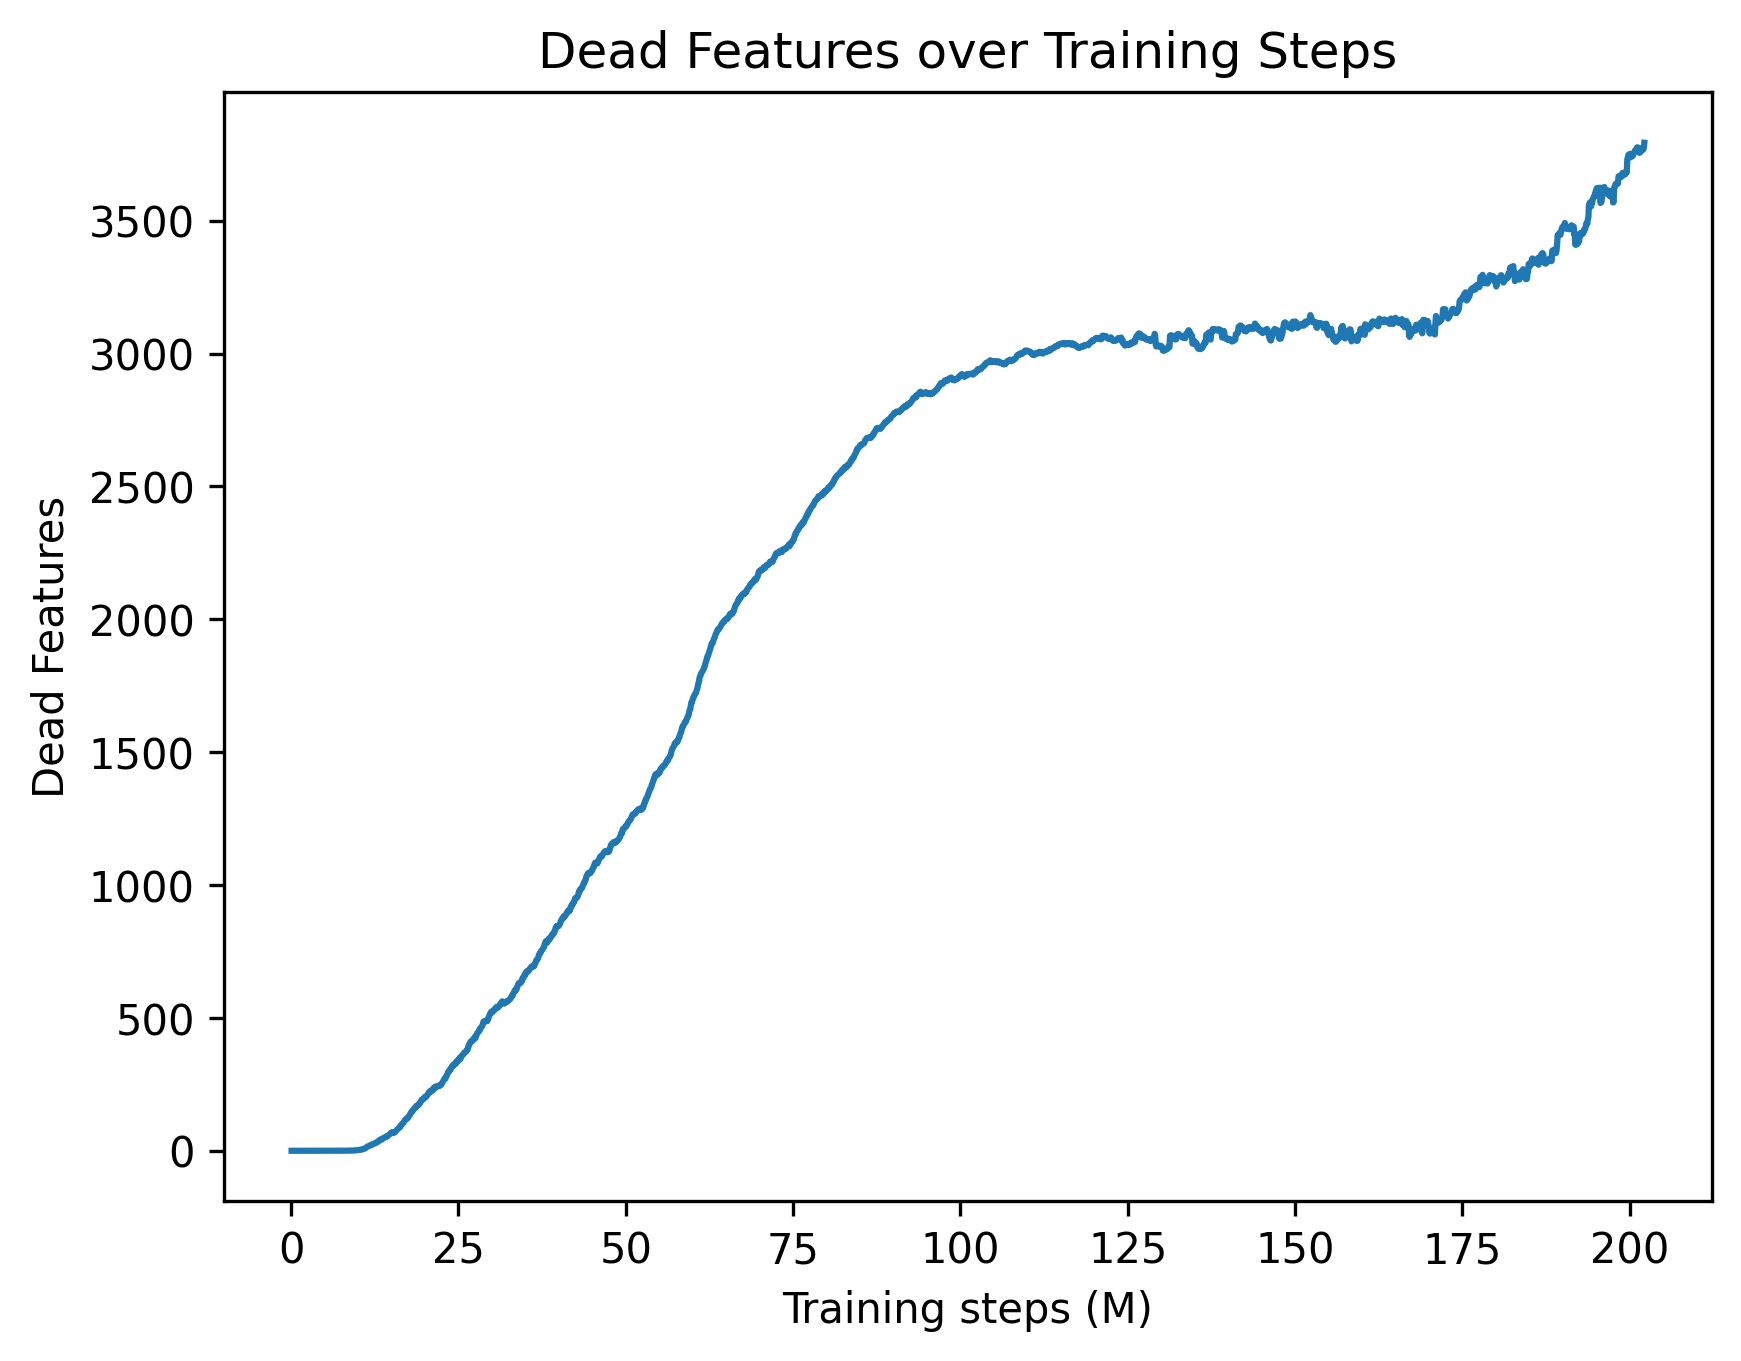
The image displays a single-line chart titled "Dead Features over Training Steps." It plots the cumulative count of "Dead Features" against the number of training steps, measured in millions (M). The chart shows a clear, non-linear growth pattern over the training duration.
### Components/Axes
* **Chart Title:** "Dead Features over Training Steps" (centered at the top).
* **X-Axis (Horizontal):**
* **Label:** "Training steps (M)"
* **Scale:** Linear scale from 0 to 200.
* **Major Tick Marks:** 0, 25, 50, 75, 100, 125, 150, 175, 200.
* **Y-Axis (Vertical):**
* **Label:** "Dead Features"
* **Scale:** Linear scale from 0 to approximately 3800.
* **Major Tick Marks:** 0, 500, 1000, 1500, 2000, 2500, 3000, 3500.
* **Data Series:** A single, solid blue line representing the count of dead features over time.
* **Legend:** None present. The chart contains only one data series.
* **Background:** Plain white. No grid lines, annotations, or additional visual elements are present.
### Detailed Analysis
**Trend Verification:** The blue line exhibits three distinct phases:
1. **Initial Slow Growth (0M to ~15M steps):** The line remains near zero, showing minimal increase.
2. **Rapid, Near-Linear Increase (~15M to ~100M steps):** The line slopes steeply upward, indicating a fast accumulation of dead features.
3. **Plateau with Late Uptick (~100M to 200M steps):** The growth rate slows dramatically, forming a noisy plateau between approximately 3000 and 3100 dead features from 100M to 175M steps. After 175M steps, the line resumes a clear upward trend, ending at its highest point.
**Approximate Data Points (Visual Estimation):**
* At 0M steps: ~0 dead features.
* At 25M steps: ~250 dead features.
* At 50M steps: ~1250 dead features.
* At 75M steps: ~2250 dead features.
* At 100M steps: ~2900 dead features.
* At 125M steps: ~3050 dead features.
* At 150M steps: ~3100 dead features.
* At 175M steps: ~3100 dead features (start of final uptick).
* At 200M steps: ~3800 dead features (chart maximum).
### Key Observations
1. **Sigmoidal-like Shape:** The overall curve resembles an S-shape (sigmoid), characterized by an initial lag, a period of exponential-like growth, and a final saturation phase—though the saturation is broken by a late increase.
2. **Inflection Point:** The most significant change in growth rate occurs around 100M training steps, where the steep ascent transitions to a plateau.
3. **Late-Stage Resurgence:** The renewed growth after 175M steps is a notable deviation from a pure saturation curve, suggesting a potential change in training dynamics or model behavior in the final quarter of the observed period.
4. **Noise in Plateau:** The plateau phase (100M-175M) is not perfectly flat but shows small, random fluctuations, indicating minor variability in the dead feature count during this period.
### Interpretation
This chart likely visualizes a phenomenon in machine learning model training, where "dead features" refer to neurons or components in a neural network that have ceased to activate or contribute meaningfully (e.g., due to the "dying ReLU" problem).
* **What the data suggests:** The accumulation of dead features is not constant. It accelerates dramatically during the core learning phase (15M-100M steps), suggesting that as the model learns and specializes, a significant number of features become obsolete or inactive. The plateau indicates a period of relative stability where the number of dead features is maintained. The final uptick is critical—it may signal overtraining, a shift in the data distribution, or the model entering a new phase where previously stable features begin to die off again.
* **Relationship between elements:** The x-axis (training steps) is the independent variable driving the change in the dependent variable (dead features). The shape of the curve directly maps the lifecycle of feature utility throughout the training process.
* **Notable Anomalies:** The primary anomaly is the late-stage increase after 175M steps. In a typical saturation scenario, one would expect the curve to flatten completely. This uptick warrants investigation—it could be an artifact of the specific training run or an indicator of a meaningful model pathology emerging late in training. The initial near-zero phase also indicates a "warm-up" period before feature death becomes prevalent.