## Line Graph: Dead Features over Training Steps
### Overview
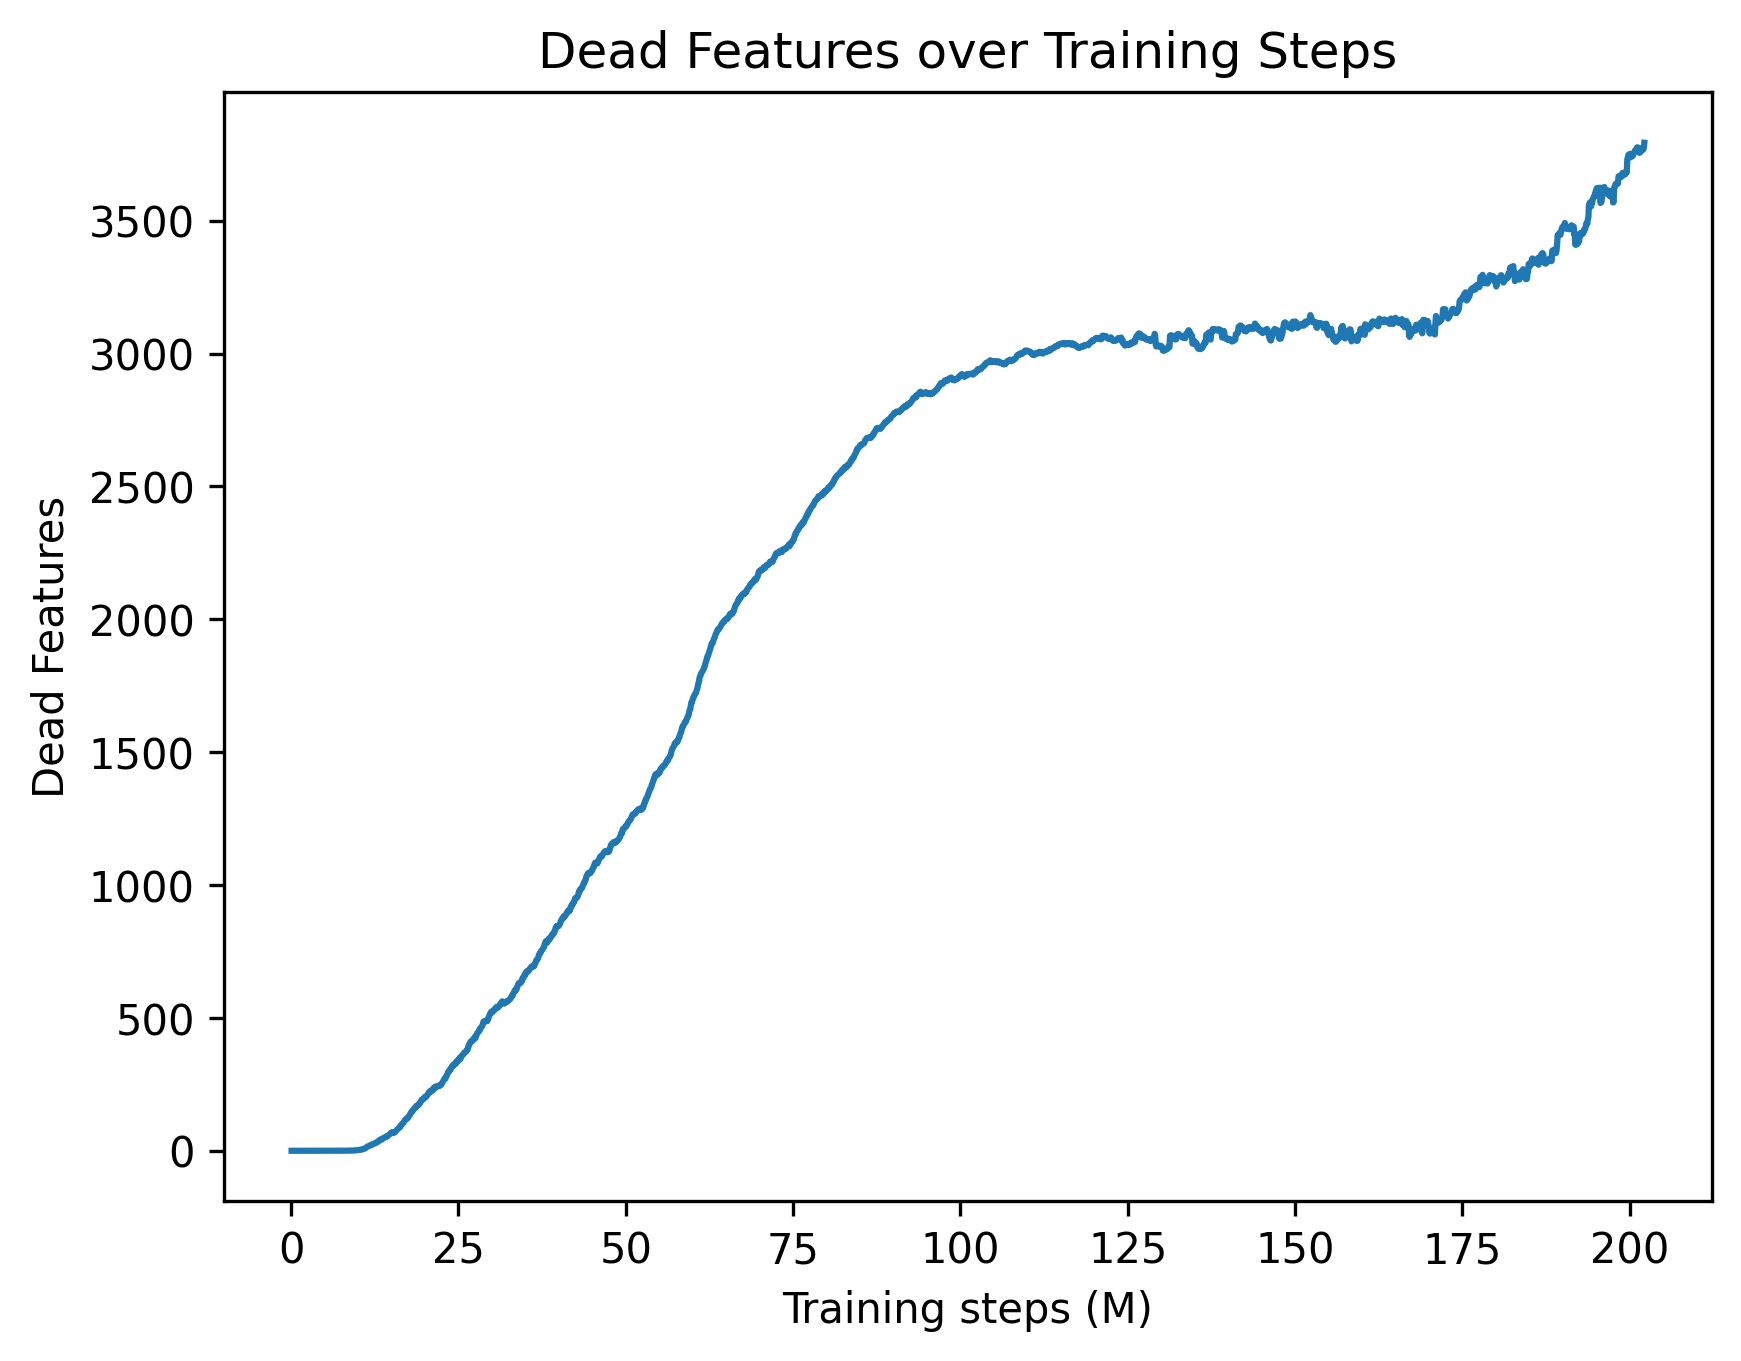
The graph illustrates the relationship between training steps (in millions) and the number of dead features in a model. The blue line shows a steady increase in dead features as training progresses, with minor fluctuations. The y-axis ranges from 0 to 3500, while the x-axis spans 0 to 200 million training steps.
### Components/Axes
- **Title**: "Dead Features over Training Steps" (top-center).
- **X-axis**: "Training steps (M)" with increments at 0, 25, 50, 75, 100, 125, 150, 175, and 200 million.
- **Y-axis**: "Dead Features" with increments at 0, 500, 1000, 1500, 2000, 2500, 3000, and 3500.
- **Legend**: Located in the top-right corner, labeled "Dead Features" with a blue line.
- **Line**: A single blue line representing dead features, starting at (0, 0) and ending near (200M, 3750).
### Detailed Analysis
- **Initial Phase (0–50M steps)**: The line rises gradually from 0 to ~1000 dead features. At 25M steps, it reaches ~500; at 50M steps, ~1000.
- **Mid-Phase (50–100M steps)**: Accelerated growth occurs. At 75M steps, ~2000 dead features; at 100M steps, ~2500.
- **Late Phase (100–200M steps)**: The line plateaus briefly (~2500–3000) between 100M–150M steps, then rises sharply. At 175M steps, ~3200; at 200M steps, ~3750.
### Key Observations
1. **Steady Increase**: Dead features consistently rise with training steps, indicating a potential degradation or overfitting trend.
2. **Plateau**: A temporary stabilization (~2500–3000) occurs between 100M–150M steps, suggesting possible model stabilization or data saturation.
3. **Final Surge**: A sharp increase after 150M steps, exceeding 3500 dead features by 200M steps, highlighting escalating instability.
### Interpretation
The data suggests that as training progresses, the model accumulates more dead features, which could impair performance. The initial gradual rise may reflect early-stage learning, while the mid-phase acceleration could indicate overfitting or vanishing gradients. The plateau might represent a balance between learning and feature death, but the final surge implies critical instability, possibly due to excessive training or insufficient regularization. This trend underscores the need for monitoring dead features during training to optimize model robustness.