\n
## Line Chart: WinRate/ASR vs. SecAlign DPO Learning Rate
### Overview
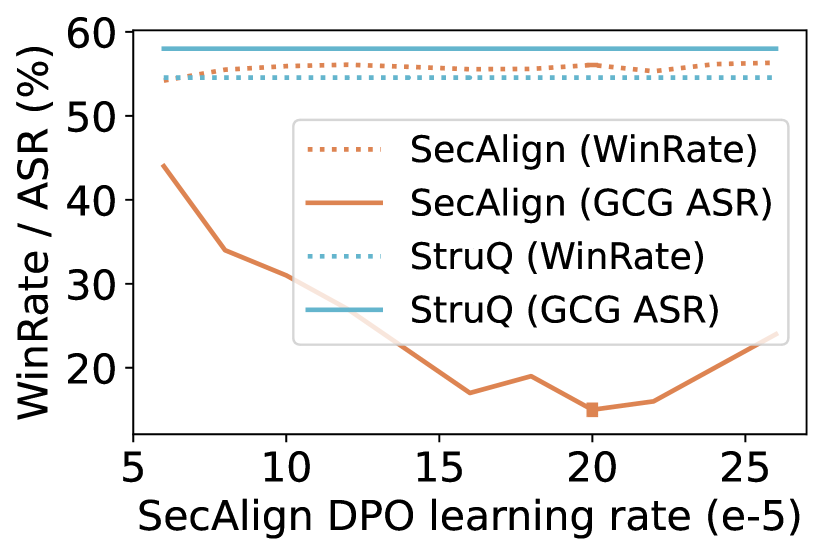
This line chart displays the relationship between the SecAlign DPO learning rate (e-5) and the WinRate/ASR (%) for two models: SecAlign and StruQ. The chart shows two metrics for each model: WinRate and GCG ASR (presumably a type of Automatic Speech Recognition score).
### Components/Axes
* **X-axis:** SecAlign DPO learning rate (e-5). Scale ranges from approximately 5 to 25, with markers at 5, 10, 15, 20, and 25.
* **Y-axis:** WinRate / ASR (%). Scale ranges from approximately 10 to 60, with markers at 10, 20, 30, 40, 50, and 60.
* **Legend:** Located in the top-center of the chart. Contains the following entries:
* SecAlign (WinRate) - represented by a dotted orange line.
* SecAlign (GCG ASR) - represented by a solid brown line.
* StruQ (WinRate) - represented by a dotted blue line.
* StruQ (GCG ASR) - represented by a solid teal line.
### Detailed Analysis
* **SecAlign (WinRate):** The dotted orange line starts at approximately 43% at a learning rate of 5 and generally decreases, reaching a minimum of around 14% at a learning rate of 20. It then increases to approximately 21% at a learning rate of 25.
* **SecAlign (GCG ASR):** The solid brown line starts at approximately 34% at a learning rate of 5 and decreases steadily to around 14% at a learning rate of 20. It then increases to approximately 20% at a learning rate of 25.
* **StruQ (WinRate):** The dotted blue line is relatively flat, starting at approximately 56% at a learning rate of 5 and remaining around 55-57% throughout the range of learning rates, ending at approximately 56% at a learning rate of 25.
* **StruQ (GCG ASR):** The solid teal line starts at approximately 31% at a learning rate of 5 and decreases to around 26% at a learning rate of 20. It then increases to approximately 28% at a learning rate of 25.
### Key Observations
* Both SecAlign metrics (WinRate and GCG ASR) show a significant decrease as the learning rate increases from 5 to 20, followed by a slight increase from 20 to 25.
* StruQ (WinRate) remains consistently high and relatively stable across all learning rates.
* StruQ (GCG ASR) shows a slight decrease from 5 to 20, then a slight increase from 20 to 25.
* SecAlign's WinRate and GCG ASR are significantly lower than StruQ's WinRate.
* The WinRate and GCG ASR for SecAlign are relatively close in value across the learning rate range.
### Interpretation
The data suggests that the SecAlign model is more sensitive to the DPO learning rate than the StruQ model. Increasing the learning rate from 5 to 20 significantly reduces both the WinRate and GCG ASR for SecAlign, indicating potential overfitting or instability. The slight recovery at a learning rate of 25 might suggest a sweet spot or a diminishing return.
StruQ, on the other hand, maintains a high WinRate regardless of the learning rate, indicating robustness. The slight fluctuations in StruQ's GCG ASR are minimal and may not be statistically significant.
The consistent difference between SecAlign and StruQ suggests that StruQ is a more effective model, or that SecAlign requires more careful tuning of the learning rate. The fact that both metrics for SecAlign move in similar patterns suggests that the learning rate affects both the win rate and the ASR performance in a similar way. Further investigation would be needed to understand the underlying reasons for these differences and to optimize the learning rate for SecAlign.