## Line Chart: SecAlign vs. StruQ Performance Across DPO Learning Rates
### Overview
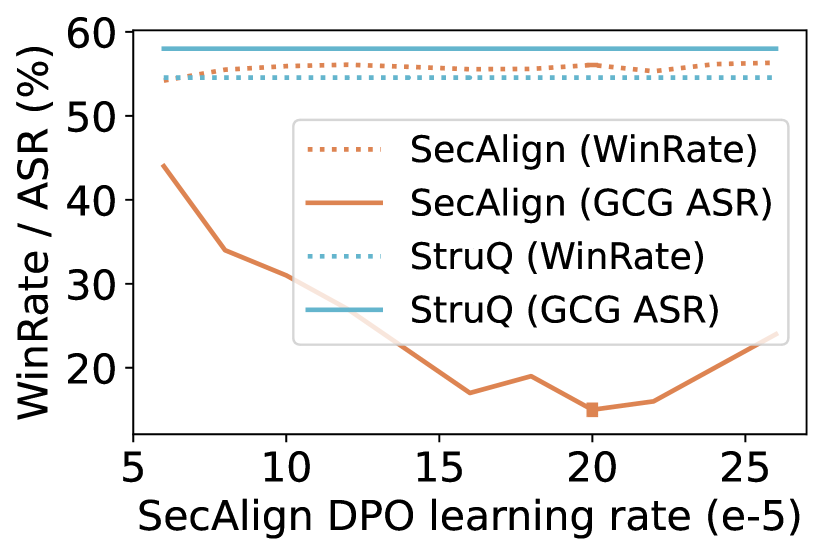
This line chart compares the performance of two methods—**SecAlign** and **StruQ**—across two metrics: *WinRate* (dotted lines) and *GCG ASR* (solid lines), as a function of the **SecAlign DPO learning rate** (scaled by \(10^{-5}\)). The x-axis represents the learning rate, and the y-axis represents the percentage of WinRate or GCG ASR.
### Components/Axes
- **X-axis**: Label = "SecAlign DPO learning rate (e-5)". Ticks at 5, 10, 15, 20, 25 (representing \(5 \times 10^{-5}\) to \(25 \times 10^{-5}\)).
- **Y-axis**: Label = "WinRate / ASR (%)". Ticks at 20, 30, 40, 50, 60 (percentage scale).
- **Legend** (top-right, inside the plot):
- Dotted orange: *SecAlign (WinRate)*
- Solid orange: *SecAlign (GCG ASR)*
- Dotted blue: *StruQ (WinRate)*
- Solid blue: *StruQ (GCG ASR)*
### Detailed Analysis
We analyze each data series by trend and key points:
1. **SecAlign (WinRate) [Dotted Orange]**:
- Trend: Flat (no significant change with learning rate).
- Values: ~55% at all learning rates (5, 10, 15, 20, 25).
2. **SecAlign (GCG ASR) [Solid Orange]**:
- Trend: Decreases from \(5 \times 10^{-5}\) to \(20 \times 10^{-5}\), then increases at \(25 \times 10^{-5}\).
- Key points:
- \(5 \times 10^{-5}\): ~45%
- \(10 \times 10^{-5}\): ~35%
- \(15 \times 10^{-5}\): ~20%
- \(20 \times 10^{-5}\): ~15% (minimum)
- \(25 \times 10^{-5}\): ~25%
3. **StruQ (WinRate) [Dotted Blue]**:
- Trend: Flat (no significant change with learning rate).
- Values: ~55% at all learning rates (matches SecAlign WinRate).
4. **StruQ (GCG ASR) [Solid Blue]**:
- Trend: Flat (no significant change with learning rate).
- Values: ~58% at all learning rates (highest among all series).
### Key Observations
- **WinRate Stability**: Both SecAlign and StruQ have stable WinRate (~55%) across all learning rates, indicating the learning rate does not impact WinRate.
- **GCG ASR Sensitivity**: SecAlign’s GCG ASR is highly sensitive to learning rate (decreasing then increasing), while StruQ’s GCG ASR is stable and higher (~58%).
- **Performance Gap**: StruQ’s GCG ASR (solid blue) is consistently higher than SecAlign’s GCG ASR (solid orange) across all learning rates.
### Interpretation
The chart suggests:
- **StruQ is more robust** to changes in SecAlign DPO learning rate for GCG ASR, maintaining a high and stable performance.
- **SecAlign’s GCG ASR is learning-rate dependent**: It degrades with increasing learning rate (up to \(20 \times 10^{-5}\)) but partially recovers at \(25 \times 10^{-5}\).
- **WinRate is unaffected** by learning rate for both methods, implying the learning rate does not influence this metric.
This data could inform model selection: StruQ may be preferred for stable GCG ASR, while SecAlign requires careful tuning of the learning rate to optimize GCG ASR.