## Diagram: Relation Evaluation
### Overview
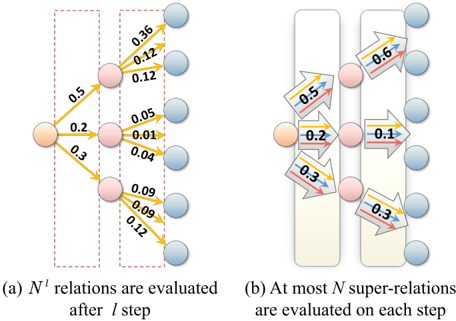
The image presents two diagrams illustrating the evaluation of relations and super-relations in a multi-step process. Diagram (a) shows the evaluation of N¹ relations after *l* steps, while diagram (b) depicts the evaluation of at most N super-relations on each step. Both diagrams use nodes and arrows to represent the flow and probabilities associated with these evaluations.
### Components/Axes
**Diagram (a):**
* **Nodes:** Three columns of nodes. The first column contains one orange node. The second column contains three pink nodes. The third column contains six blue nodes.
* **Arrows:** Yellow arrows connect the nodes, indicating the flow of relations. Each arrow is labeled with a probability value.
* **Text:**
* "(a) N¹ relations are evaluated after *l* step"
* **Dashed Rectangles:** Two dashed rectangles surround the second and third columns of nodes.
**Diagram (b):**
* **Nodes:** Three columns of nodes. The first column contains one orange node. The second column contains three pink nodes. The third column contains six blue nodes.
* **Arrows:** Arrows connect the nodes, indicating the flow of super-relations. Each arrow is labeled with a probability value. The arrows are colored with a gradient from blue to yellow to red.
* **Text:**
* "(b) At most N super-relations are evaluated on each step"
* **Rectangles:** Two light-yellow rectangles surround the second and third columns of nodes.
### Detailed Analysis
**Diagram (a): N¹ relations are evaluated after *l* step**
* The initial orange node branches out to three pink nodes with probabilities:
* Top pink node: 0.5
* Middle pink node: 0.2
* Bottom pink node: 0.3
* Each pink node branches out to two blue nodes with probabilities:
* Top pink node: 0.36 and 0.12 and 0.12
* Middle pink node: 0.05 and 0.01 and 0.04
* Bottom pink node: 0.09 and 0.09 and 0.12
**Diagram (b): At most N super-relations are evaluated on each step**
* The initial orange node branches out to three pink nodes with probabilities:
* Top pink node: 0.5
* Middle pink node: 0.2
* Bottom pink node: 0.3
* Each pink node branches out to a blue node with probabilities:
* Top pink node: 0.6
* Middle pink node: 0.1
* Bottom pink node: 0.3
### Key Observations
* Diagram (a) shows a branching structure where each node can lead to multiple subsequent nodes, representing the evaluation of multiple relations.
* Diagram (b) shows a similar branching structure, but with a focus on super-relations and a different set of probabilities.
* The probabilities associated with each branch indicate the likelihood of that particular relation or super-relation being evaluated.
### Interpretation
The diagrams illustrate a hierarchical evaluation process, where initial relations or super-relations are evaluated, leading to further evaluations based on associated probabilities. Diagram (a) suggests an exhaustive evaluation of N¹ relations, while diagram (b) focuses on evaluating at most N super-relations on each step. The probabilities likely represent the confidence or relevance of each relation or super-relation in a given context. The difference in probabilities between the two diagrams suggests different evaluation strategies or criteria.