TECHNICAL ASSET FINGERPRINT
46ca0257ec66f8f7c904ce37
Click to view fullscreen
Press ESC or click to close
FOUND IN PAPERS
EXPERT: healer-alpha-free VERSION 1
RUNTIME: free/openrouter/healer-alpha
INTEL_VERIFIED
## Diagram: Relational Evaluation Process
### Overview
The image displays two side-by-side diagrams, labeled (a) and (b), illustrating different methods for evaluating relations within a network or graph structure. Both diagrams use a consistent visual language: an orange starting node, pink intermediate nodes, and blue endpoint nodes, connected by colored arrows with numerical values. The diagrams contrast a broad, tree-like evaluation (a) with a more constrained, grouped evaluation (b).
### Components/Axes
* **Diagram (a) - Left Side:**
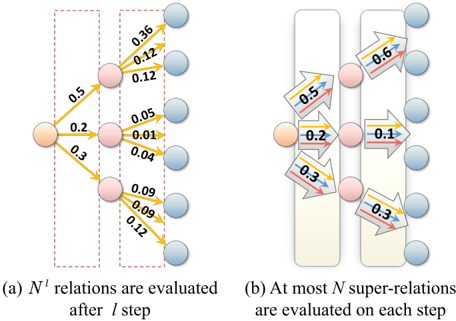
* **Title/Caption:** "(a) \(N^I\) relations are evaluated after \(I\) step"
* **Structure:** A hierarchical tree expanding from left to right.
* **Nodes:**
* One orange node on the far left.
* Three pink nodes in a vertical column in the center.
* Nine blue nodes in a vertical column on the right.
* **Arrows & Values:** Arrows connect nodes with associated numerical values.
* From the orange node to the three pink nodes: Values are **0.5** (top), **0.2** (middle), **0.3** (bottom).
* From the top pink node to three blue nodes: Values are **0.35**, **0.12**, **0.12**.
* From the middle pink node to three blue nodes: Values are **0.05**, **0.01**, **0.04**.
* From the bottom pink node to three blue nodes: Values are **0.09**, **0.09**, **0.12**.
* **Spatial Layout:** The entire structure is enclosed within two vertical, red-dashed rectangular boxes. The first box contains the orange node and the arrows to the pink nodes. The second box contains the pink nodes and all arrows to the blue nodes.
* **Diagram (b) - Right Side:**
* **Title/Caption:** "(b) At most \(N\) super-relations are evaluated on each step"
* **Structure:** Two vertical columns of nodes with grouped arrows between them.
* **Nodes:**
* One orange node on the left.
* Three pink nodes in a vertical column in the center.
* Three blue nodes in a vertical column on the right.
* **Arrows & Values:** Arrows are grouped into three distinct, shaded rectangular blocks, each containing multiple arrows.
* **Top Block:** Connects the top pink node to the top blue node. Contains a large arrow labeled **-0.5** and two smaller, nested arrows labeled **-0.12** and **-0.12**.
* **Middle Block:** Connects the middle pink node to the middle blue node. Contains a large arrow labeled **-0.2** and two smaller, nested arrows labeled **-0.01** and **-0.04**.
* **Bottom Block:** Connects the bottom pink node to the bottom blue node. Contains a large arrow labeled **-0.3** and two smaller, nested arrows labeled **-0.09** and **-0.12**.
* **Spatial Layout:** The three blocks are arranged vertically. The orange node connects to the pink nodes via simple arrows without explicit values shown in this diagram.
### Detailed Analysis
**Diagram (a) Analysis:**
* **Trend:** The diagram shows a multiplicative or branching expansion. A single source leads to three intermediates, each of which leads to three endpoints, resulting in nine total terminal relations.
* **Data Points (All values are positive):**
* **Step 1 (Orange to Pink):** 0.5, 0.2, 0.3
* **Step 2 (Pink to Blue):**
* From top pink (0.5 source): 0.35, 0.12, 0.12
* From middle pink (0.2 source): 0.05, 0.01, 0.04
* From bottom pink (0.3 source): 0.09, 0.09, 0.12
**Diagram (b) Analysis:**
* **Trend:** The diagram shows a constrained evaluation where multiple fine-grained relations are aggregated into a single "super-relation" per step. The large arrow in each block represents the super-relation, while the smaller arrows represent the constituent relations.
* **Data Points (All values are negative):**
* **Super-Relation Values (Large Arrows):** -0.5, -0.2, -0.3
* **Constituent Relation Values (Small Arrows within blocks):**
* Block 1: -0.12, -0.12
* Block 2: -0.01, -0.04
* Block 3: -0.09, -0.12
### Key Observations
1. **Numerical Correspondence:** The absolute values of the super-relations in (b) (-0.5, -0.2, -0.3) exactly match the values of the first-step relations in (a) (0.5, 0.2, 0.3). This suggests the super-relation in (b) encapsulates the initial connection strength from (a).
2. **Value Inversion:** All values in diagram (b) are negative, while all in (a) are positive. This likely signifies a change in semantics, such as representing costs, penalties, or inverse strengths.
3. **Structural Difference:** Diagram (a) evaluates all possible paths (9 terminal relations), while diagram (b) evaluates only 3 aggregated super-relations per step, implying a computational or conceptual simplification.
4. **Visual Encoding:** The use of dashed boxes in (a) clearly separates the two evaluation steps. The solid, shaded blocks in (b) visually enforce the grouping of relations into single units.
### Interpretation
These diagrams appear to contrast two paradigms for processing relational data, likely in fields like graph neural networks, knowledge graphs, or probabilistic graphical models.
* **Diagram (a)** represents an **exhaustive evaluation**. The notation \(N^I\) suggests exponential growth in the number of relations (\(N\) relations per node, evaluated over \(I\) steps). This captures all possible interaction paths but may be computationally expensive. The positive values could represent affinity, probability, or connection strength.
* **Diagram (b)** represents a **compressed or approximate evaluation**. The notation "At most \(N\) super-relations" indicates a linear or bounded complexity. By grouping fine-grained relations into a single super-relation (with a value matching the initial step's strength), the model simplifies the computation. The negative values strongly imply this is a different operational space—perhaps representing energy, loss, or a transformed feature space where aggregation occurs.
The core message is a trade-off: **completeness versus efficiency**. Diagram (a) is thorough but costly; diagram (b) is efficient but lossy, aggregating detailed information into summary "super-relations." The exact mathematical relationship between the constituent values in (b) (e.g., -0.12, -0.12) and the super-relation value (-0.5) is not explicitly shown, leaving room for interpretation about the aggregation function (e.g., summation, averaging, or a more complex operation).
DECODING INTELLIGENCE...