## Diagram: Relational Evaluation Models (a) and (b)
### Overview
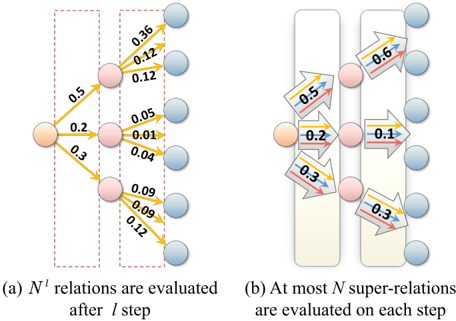
The image presents two diagrams illustrating relational evaluation processes. Diagram (a) shows a network of nodes with weighted directional arrows, while diagram (b) depicts a more complex structure with multi-colored arrows and layered nodes. Both diagrams emphasize the evaluation of relationships over discrete steps, with numerical annotations indicating relationship strengths or probabilities.
### Components/Axes
- **Nodes**:
- Pink and blue circular nodes represent entities or states.
- Positioned in vertical columns (left and right) in both diagrams.
- **Arrows**:
- Yellow arrows in diagram (a) with numerical labels (e.g., 0.5, 0.3, 0.12).
- Multi-colored arrows (yellow, blue, red) in diagram (b) with numerical labels (e.g., 0.5, 0.2, 0.3, 0.6, 0.1).
- **Captions**:
- (a) "N^l relations are evaluated after l step"
- (b) "At most N super-relations are evaluated on each step"
### Detailed Analysis
#### Diagram (a)
- **Structure**:
- Left column: 3 pink nodes connected to 5 blue nodes via yellow arrows.
- Right column: 3 pink nodes connected to 5 blue nodes via yellow arrows.
- **Values**:
- Arrows show decreasing values from top to bottom (e.g., 0.5 → 0.3 → 0.12).
- Right column arrows have smaller values (e.g., 0.09, 0.09, 0.12).
- **Spatial Grounding**:
- Arrows originate from pink nodes (left) and terminate at blue nodes (right).
- Values decrease progressively along the vertical axis.
#### Diagram (b)
- **Structure**:
- Left column: 2 pink nodes connected to 5 blue nodes via multi-colored arrows.
- Right column: 2 pink nodes connected to 5 blue nodes via multi-colored arrows.
- **Values**:
- Arrows show mixed values (e.g., 0.5, 0.2, 0.3 on left; 0.6, 0.1, 0.3 on right).
- Arrows with multiple colors (e.g., yellow/blue/red) suggest layered or composite relationships.
- **Spatial Grounding**:
- Arrows originate from pink nodes (left) and terminate at blue nodes (right).
- Values vary independently across arrows, with no clear vertical progression.
### Key Observations
1. **Step-Based Evaluation**:
- Diagram (a) evaluates a fixed number of relations (`N^l`) after each step (`l`).
- Diagram (b) evaluates up to `N` super-relations per step, implying parallel or concurrent evaluations.
2. **Value Trends**:
- Diagram (a) shows diminishing relationship strengths (e.g., 0.5 → 0.12).
- Diagram (b) exhibits mixed values (e.g., 0.6, 0.1, 0.3), suggesting variable relationship dynamics.
3. **Color Coding**:
- Yellow arrows dominate diagram (a), while diagram (b) uses yellow, blue, and red arrows. No legend explains color significance, but multi-coloring in (b) may indicate relationship types or priorities.
### Interpretation
- **Model Differences**:
- Diagram (a) represents a sequential, diminishing relational model, where each step evaluates fewer relations.
- Diagram (b) suggests a parallel or multi-dimensional approach, evaluating multiple super-relations simultaneously with varying strengths.
- **Implications**:
- The use of "super-relations" in (b) implies hierarchical or composite relationships, potentially for complex systems requiring multi-step evaluations.
- Numerical values likely represent probabilities, weights, or confidence scores, critical for decision-making in dynamic networks.
- **Anomalies**:
- Diagram (b) lacks a clear trend in values, suggesting non-linear or context-dependent relationship dynamics.
- The absence of a legend leaves the meaning of arrow colors open to interpretation, though their presence hints at categorical distinctions.
This analysis highlights how the diagrams model relational processes, emphasizing step-based evaluation and the trade-offs between sequential and parallel approaches in network analysis.