# Technical Document Extraction: Test Loss Analysis
## 1. Document Metadata
* **Title:** Test Loss: Gradient Norm vs. Epsilon
* **Type:** Line Chart with markers
* **Primary Language:** English
## 2. Component Isolation
### Header
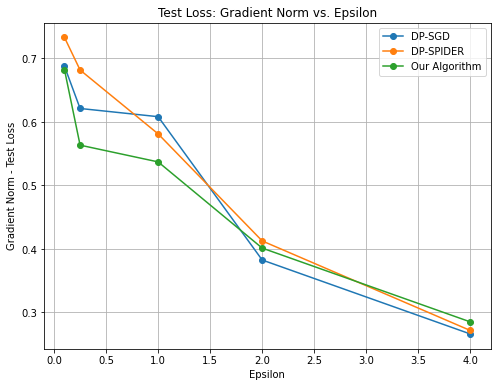
* **Main Title:** "Test Loss: Gradient Norm vs. Epsilon"
### Main Chart Area
* **X-Axis Label:** "Epsilon"
* **X-Axis Scale:** Linear, ranging from 0.0 to 4.0 with major grid lines every 0.5 units.
* **Y-Axis Label:** "Gradient Norm - Test Loss"
* **Y-Axis Scale:** Linear, ranging from approximately 0.25 to 0.75 with major grid lines every 0.1 units.
* **Grid:** Major grid lines are present for both X and Y axes.
### Legend (Spatial Grounding: Top Right [x≈0.8, y≈0.9])
* **Blue Line with Circle Marker:** DP-SGD
* **Orange Line with Circle Marker:** DP-SPIDER
* **Green Line with Circle Marker:** Our Algorithm
## 3. Trend Verification and Data Extraction
All three data series exhibit a **downward trend**, indicating that as the Epsilon value increases (privacy budget increases/privacy constraint relaxes), the Gradient Norm of the Test Loss decreases.
### Data Series 1: DP-SGD (Blue)
* **Trend:** Sharp initial drop between Epsilon 0.1 and 0.25, followed by a very shallow decline until Epsilon 1.0, then a steeper decline to Epsilon 2.0, finishing with a steady decline to Epsilon 4.0.
* **Estimated Data Points:**
* Epsilon 0.1: ~0.69
* Epsilon 0.25: ~0.62
* Epsilon 1.0: ~0.61
* Epsilon 2.0: ~0.38
* Epsilon 4.0: ~0.26
### Data Series 2: DP-SPIDER (Orange)
* **Trend:** Consistent downward slope. It starts with the highest loss at low Epsilon values but converges toward the other algorithms as Epsilon increases.
* **Estimated Data Points:**
* Epsilon 0.1: ~0.73
* Epsilon 0.25: ~0.68
* Epsilon 1.0: ~0.58
* Epsilon 2.0: ~0.41
* Epsilon 4.0: ~0.27
### Data Series 3: Our Algorithm (Green)
* **Trend:** Shows the lowest loss values for the majority of the low-to-mid Epsilon range (0.1 to 1.5). It features a very sharp drop between Epsilon 0.1 and 0.25.
* **Estimated Data Points:**
* Epsilon 0.1: ~0.68
* Epsilon 0.25: ~0.56
* Epsilon 1.0: ~0.54
* Epsilon 2.0: ~0.40
* Epsilon 4.0: ~0.28
## 4. Reconstructed Data Table
| Epsilon | DP-SGD (Blue) | DP-SPIDER (Orange) | Our Algorithm (Green) |
| :--- | :--- | :--- | :--- |
| **0.1** | 0.69 | 0.73 | 0.68 |
| **0.25** | 0.62 | 0.68 | 0.56 |
| **1.0** | 0.61 | 0.58 | 0.54 |
| **2.0** | 0.38 | 0.41 | 0.40 |
| **4.0** | 0.26 | 0.27 | 0.28 |
## 5. Summary of Findings
"Our Algorithm" (Green) consistently outperforms DP-SGD and DP-SPIDER in the high-privacy regime (Epsilon < 1.5), maintaining a lower gradient norm for the test loss. At Epsilon = 2.0, DP-SGD (Blue) achieves the lowest loss. By Epsilon = 4.0, all three algorithms converge to a similar performance level between 0.26 and 0.28, with DP-SGD being marginally the most efficient at that specific point.