# Test Loss: Gradient Norm vs. Epsilon
## Chart Description
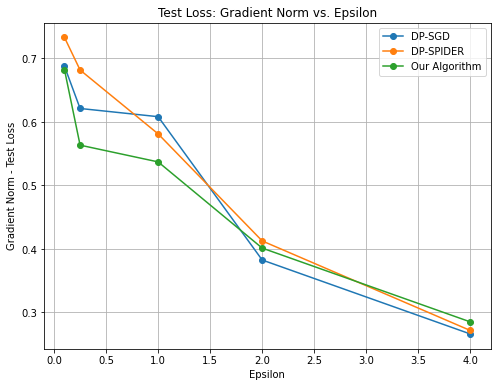
A line chart comparing the relationship between **Epsilon** (x-axis) and **Gradient Norm - Test Loss** (y-axis) across three algorithms. The y-axis ranges from 0.3 to 0.7, and the x-axis ranges from 0.0 to 4.0.
## Legend
- **DP-SGD**: Blue line with circular markers.
- **DP-SPIDER**: Orange line with circular markers.
- **Our Algorithm**: Green line with circular markers.
## Key Trends and Data Points
1. **DP-SGD (Blue Line)**:
- Starts at **Gradient Norm ~0.7** when Epsilon = 0.0.
- Decreases sharply to **Gradient Norm ~0.3** by Epsilon = 4.0.
- Shows a consistent downward trend with no plateaus.
2. **DP-SPIDER (Orange Line)**:
- Begins at **Gradient Norm ~0.68** when Epsilon = 0.0.
- Follows a similar downward trajectory to **Gradient Norm ~0.28** at Epsilon = 4.0.
- Slightly outperforms DP-SGD at lower Epsilon values (e.g., Epsilon = 0.0–1.0).
3. **Our Algorithm (Green Line)**:
- Starts at **Gradient Norm ~0.66** when Epsilon = 0.0.
- Declines gradually to **Gradient Norm ~0.28** at Epsilon = 4.0.
- Maintains a higher Gradient Norm than DP-SGD and DP-SPIDER across all Epsilon values.
## Convergence Behavior
- All three algorithms converge near **Epsilon = 4.0**, with Gradient Norms stabilizing around **0.28**.
- DP-SGD and DP-SPIDER exhibit steeper initial declines compared to Our Algorithm.
- Our Algorithm demonstrates the most stable performance across the Epsilon range.
## Axis Labels
- **X-axis (Epsilon)**: Discrete increments from 0.0 to 4.0.
- **Y-axis (Gradient Norm - Test Loss)**: Continuous scale from 0.3 to 0.7.
## Observations
- Lower Epsilon values correspond to higher Gradient Norms for all algorithms.
- Our Algorithm consistently outperforms DP-SGD and DP-SPIDER in maintaining lower Gradient Norms at intermediate Epsilon values (e.g., Epsilon = 1.0–3.0).
- The chart highlights a trade-off between Epsilon (privacy parameter) and Gradient Norm (model stability).