## Chart Type: Training and Testing Accuracy vs. Epoch
### Overview
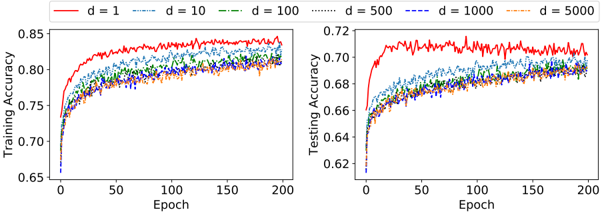
The image presents two line charts comparing the training and testing accuracy of a model across 200 epochs for different values of 'd' (likely representing dimensionality or a similar parameter). The left chart displays training accuracy, while the right chart shows testing accuracy. Each chart plots accuracy against the number of epochs, with different lines representing different values of 'd'.
### Components/Axes
* **X-axis (both charts):** Epoch, ranging from 0 to 200.
* **Y-axis (left chart):** Training Accuracy, ranging from 0.65 to 0.85.
* **Y-axis (right chart):** Testing Accuracy, ranging from 0.62 to 0.72.
* **Legend (top):** Located above both charts, it identifies the lines by color and 'd' value:
* Red: d = 1
* Blue (dashed): d = 10
* Green (dash-dotted): d = 100
* Black (dotted): d = 500
* Dark Blue (dash-dot-dotted): d = 1000
* Orange (dash-dot-dash): d = 5000
### Detailed Analysis
**Left Chart: Training Accuracy**
* **d = 1 (Red):** Starts at approximately 0.70 accuracy, rapidly increases to around 0.82 by epoch 25, and then gradually increases to approximately 0.84-0.85, with some fluctuations.
* **d = 10 (Blue, dashed):** Starts at approximately 0.65 accuracy, increases rapidly to around 0.78 by epoch 25, and then gradually increases to approximately 0.81-0.82.
* **d = 100 (Green, dash-dotted):** Starts at approximately 0.65 accuracy, increases rapidly to around 0.77 by epoch 25, and then gradually increases to approximately 0.80-0.81.
* **d = 500 (Black, dotted):** Starts at approximately 0.65 accuracy, increases rapidly to around 0.76 by epoch 25, and then gradually increases to approximately 0.79-0.80.
* **d = 1000 (Dark Blue, dash-dot-dotted):** Starts at approximately 0.65 accuracy, increases rapidly to around 0.76 by epoch 25, and then gradually increases to approximately 0.79-0.80.
* **d = 5000 (Orange, dash-dot-dash):** Starts at approximately 0.65 accuracy, increases rapidly to around 0.75 by epoch 25, and then gradually increases to approximately 0.79-0.80.
**Right Chart: Testing Accuracy**
* **d = 1 (Red):** Starts at approximately 0.66 accuracy, rapidly increases to around 0.71 by epoch 25, and then fluctuates around 0.71.
* **d = 10 (Blue, dashed):** Starts at approximately 0.62 accuracy, increases rapidly to around 0.67 by epoch 25, and then gradually increases to approximately 0.69.
* **d = 100 (Green, dash-dotted):** Starts at approximately 0.62 accuracy, increases rapidly to around 0.67 by epoch 25, and then gradually increases to approximately 0.68-0.69.
* **d = 500 (Black, dotted):** Starts at approximately 0.62 accuracy, increases rapidly to around 0.66 by epoch 25, and then gradually increases to approximately 0.68.
* **d = 1000 (Dark Blue, dash-dot-dotted):** Starts at approximately 0.62 accuracy, increases rapidly to around 0.66 by epoch 25, and then gradually increases to approximately 0.68.
* **d = 5000 (Orange, dash-dot-dash):** Starts at approximately 0.62 accuracy, increases rapidly to around 0.66 by epoch 25, and then gradually increases to approximately 0.68.
### Key Observations
* Training accuracy is consistently higher than testing accuracy for all values of 'd'.
* The model with d = 1 (red line) achieves the highest training and testing accuracy.
* The training accuracy for d = 1 shows more fluctuation than the other values.
* For both training and testing accuracy, the performance of d = 100, d = 500, d = 1000, and d = 5000 are very similar.
* All models show a rapid increase in accuracy in the initial epochs, followed by a slower increase or plateau.
### Interpretation
The charts suggest that a lower value of 'd' (specifically d = 1) leads to better performance in terms of both training and testing accuracy. The higher training accuracy compared to testing accuracy indicates that the models are overfitting to the training data, especially for d = 1. The similarity in performance for d = 100, d = 500, d = 1000, and d = 5000 suggests that increasing 'd' beyond a certain point does not significantly improve performance and may even hinder it due to overfitting or increased complexity. The rapid initial increase in accuracy indicates that the models learn quickly in the early stages of training, while the subsequent plateau suggests diminishing returns as training progresses.