## Line Graphs: Training and Testing Accuracy vs. Epochs
### Overview
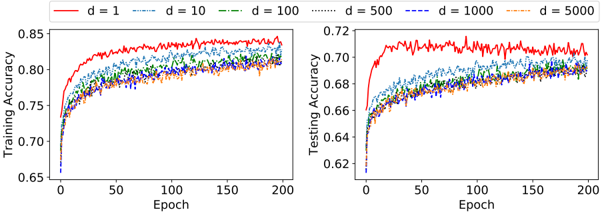
The image contains two side-by-side line graphs comparing training and testing accuracy across 200 epochs for different dimensionality values (`d = 1, 10, 100, 500, 1000, 5000`). Each graph uses distinct line styles and colors to represent the `d` values, with legends positioned at the top of each plot.
---
### Components/Axes
- **Left Graph (Training Accuracy)**:
- **X-axis**: "Epoch" (0 to 200, linear scale).
- **Y-axis**: "Training Accuracy" (0.65 to 0.85, linear scale).
- **Legend**:
- Red solid line: `d = 1`
- Blue dashed line: `d = 10`
- Green dash-dot line: `d = 100`
- Orange dotted line: `d = 500`
- Purple dash-dot-dot line: `d = 1000`
- Yellow dash-dot line: `d = 5000`
- **Right Graph (Testing Accuracy)**:
- **X-axis**: "Epoch" (0 to 200, linear scale).
- **Y-axis**: "Testing Accuracy" (0.62 to 0.72, linear scale).
- **Legend**: Same color/style mappings as the left graph.
---
### Detailed Analysis
#### Training Accuracy (Left Graph)
- **`d = 1` (Red solid line)**:
- Starts at ~0.70, rises sharply to ~0.85 by epoch 50, then plateaus with minor fluctuations.
- **`d = 10` (Blue dashed line)**:
- Begins at ~0.68, increases gradually to ~0.82 by epoch 150, then stabilizes.
- **`d = 100` (Green dash-dot line)**:
- Starts at ~0.67, rises to ~0.80 by epoch 100, then converges with higher `d` values.
- **`d = 500` (Orange dotted line)**:
- Begins at ~0.66, increases to ~0.79 by epoch 150, then overlaps with `d = 1000` and `d = 5000`.
- **`d = 1000` (Purple dash-dot-dot line)** and **`d = 5000` (Yellow dash-dot line)**:
- Both start at ~0.65, rise to ~0.78 by epoch 150, and plateau near the same level as `d = 500`.
#### Testing Accuracy (Right Graph)
- **`d = 1` (Red solid line)**:
- Starts at ~0.65, rises to ~0.70 by epoch 50, then fluctuates between ~0.68–0.71.
- **`d = 10` (Blue dashed line)**:
- Begins at ~0.64, increases to ~0.67 by epoch 100, then stabilizes.
- **`d = 100` (Green dash-dot line)**:
- Starts at ~0.63, rises to ~0.66 by epoch 150, then converges with higher `d` values.
- **`d = 500` (Orange dotted line)**:
- Begins at ~0.62, increases to ~0.66 by epoch 150, then overlaps with `d = 1000` and `d = 5000`.
- **`d = 1000` (Purple dash-dot-dot line)** and **`d = 5000` (Yellow dash-dot line)**:
- Both start at ~0.62, rise to ~0.66 by epoch 150, and plateau near the same level as `d = 500`.
---
### Key Observations
1. **Convergence of Lines**:
- For both training and testing accuracy, higher `d` values (e.g., `d ≥ 100`) show similar performance after ~100 epochs, suggesting diminishing returns for larger dimensions.
2. **Overfitting**:
- Testing accuracy consistently lags behind training accuracy, especially for smaller `d` values (e.g., `d = 1` and `d = 10`), indicating potential overfitting.
3. **Initial Performance**:
- Lower `d` values (`d = 1`, `d = 10`) achieve higher early training accuracy but struggle to generalize (testing accuracy remains lower).
4. **Stability**:
- Lines for `d ≥ 100` exhibit smoother convergence and less volatility in later epochs compared to smaller `d` values.
---
### Interpretation
The graphs demonstrate that increasing dimensionality (`d`) improves model performance up to a point, after which gains plateau. This suggests that the optimal `d` for this task lies between 100 and 500, as further increases do not significantly enhance accuracy. The persistent gap between training and testing accuracy for smaller `d` values highlights overfitting risks, where the model memorizes training data but fails to generalize. The convergence of lines for larger `d` values implies that the model’s capacity stabilizes, and additional complexity does not improve performance. This aligns with principles of model generalization, where excessive complexity can harm rather than help.