## Chart/Diagram: Transverse Field Ising Model and Correlations
### Overview
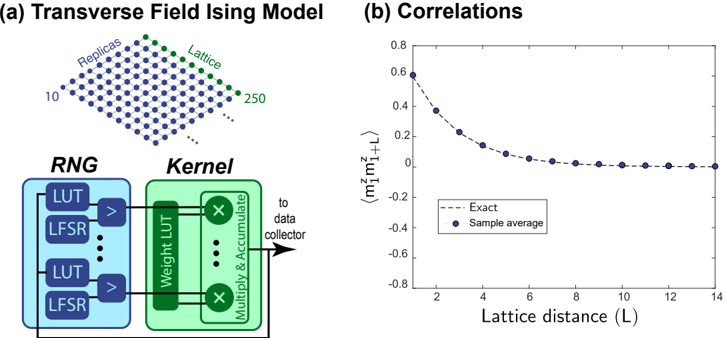
The image presents two diagrams. The first (a) illustrates a Transverse Field Ising Model with a lattice structure and a computational flow diagram involving a Random Number Generator (RNG) and a Kernel. The second (b) is a plot showing the correlation as a function of lattice distance, comparing an "Exact" theoretical curve with "Sample average" data.
### Components/Axes
**Part (a): Transverse Field Ising Model**
* **Title:** Transverse Field Ising Model
* **Lattice:** A 2D lattice structure is depicted with blue dots, labeled as "Lattice" on the right edge with green dots. The number of lattice points is indicated as 10 on the left edge and 250 on the right edge.
* **Replicas:** The lattice is also labeled as "Replicas" on the top edge with blue dots.
* **RNG (Random Number Generator):** A blue box labeled "RNG" contains two pairs of "LUT" (Look-Up Table) and "LFSR" (Linear Feedback Shift Register) components. Each pair is connected by a ">" symbol, suggesting a flow or comparison.
* **Kernel:** A green box labeled "Kernel" contains "Weight LUT" and "Multiply & Accumulate" components.
* **Flow:** The output from the RNG flows into the Kernel. The output of the Kernel is directed "to data collector" via an arrow.
**Part (b): Correlations**
* **Title:** Correlations
* **X-axis:** Lattice distance (L), ranging from 2 to 14 in increments of 2.
* **Y-axis:** `<m₁ᶻm₁₊Lᶻ>`, ranging from -0.8 to 0.8 in increments of 0.2.
* **Data Series 1:** "Exact" - Represented by a dashed black line.
* **Data Series 2:** "Sample average" - Represented by blue dots.
### Detailed Analysis
**Part (a): Transverse Field Ising Model**
* The lattice structure is a grid, with the number of points increasing from left to right.
* The RNG and Kernel represent a computational process, likely used to simulate the Ising Model.
* The flow diagram indicates that random numbers generated by the RNG are used in the Kernel to perform calculations, and the results are then collected.
**Part (b): Correlations**
* **Exact (dashed black line):** Starts at approximately 0.6 at L=2 and decreases rapidly, approaching 0 as L increases.
* **Sample average (blue dots):** Starts at approximately 0.58 at L=2 and decreases, closely following the trend of the "Exact" line. The values appear to level off around 0.08 for L > 10.
Here are the approximate data points for the "Sample average" series:
* L=2: 0.58
* L=3: 0.38
* L=4: 0.23
* L=5: 0.16
* L=6: 0.12
* L=7: 0.10
* L=8: 0.09
* L=9: 0.08
* L=10: 0.08
* L=11: 0.07
* L=12: 0.07
* L=13: 0.06
* L=14: 0.06
### Key Observations
* The correlation decreases as the lattice distance increases.
* The "Sample average" data closely matches the "Exact" theoretical curve, suggesting the simulation is accurate.
* The correlation approaches zero at larger lattice distances, indicating that spins become less correlated as the distance between them increases.
### Interpretation
The image illustrates the simulation and analysis of a Transverse Field Ising Model. The model is simulated using a computational process involving random number generation and a kernel. The correlation between spins at different lattice distances is then calculated and compared to a theoretical prediction. The close agreement between the simulation results and the theoretical curve validates the simulation method and provides insights into the behavior of the Ising Model. The decay of correlation with distance is a key characteristic of this model.