# Technical Document Extraction: Line Graph Analysis
## Chart Overview
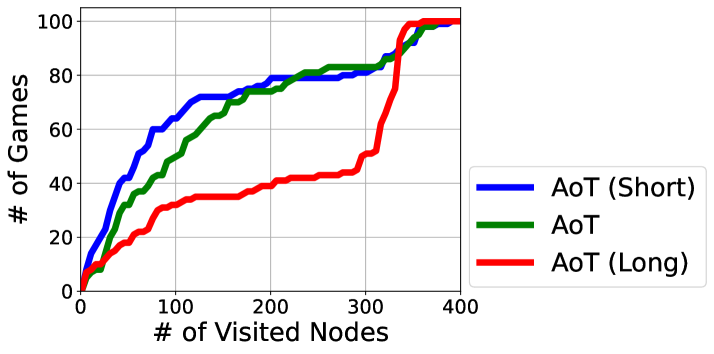
The image depicts a line graph comparing the performance of three variants of the "AoT" algorithm across varying numbers of visited nodes. The graph illustrates the relationship between the number of visited nodes (x-axis) and the number of games processed (y-axis).
---
## Axis Labels and Markers
- **X-Axis**:
- Title: `# of Visited Nodes`
- Range: `0` to `400`
- Increment: `100` (grid lines at 0, 100, 200, 300, 400)
- **Y-Axis**:
- Title: `# of Games`
- Range: `0` to `100`
- Increment: `20` (grid lines at 0, 20, 40, 60, 80, 100)
---
## Legend and Line Correspondence
- **Legend**:
- **Blue Line**: `AoT (Short)`
- **Green Line**: `AoT` (standard variant)
- **Red Line**: `AoT (Long)`
- **Line Behavior**:
- All lines originate at `(0, 0)`.
- **AoT (Short)** (blue):
- Steady linear growth until ~300 nodes.
- Plateaus at ~80 games after 300 nodes.
- **AoT** (green):
- Slightly outperforms `AoT (Short)` in early stages.
- Reaches ~90 games at 300 nodes, then plateaus.
- **AoT (Long)** (red):
- Slow initial growth (lags behind others until ~300 nodes).
- Sharp exponential increase after 300 nodes, surpassing all variants to reach ~100 games at 400 nodes.
---
## Key Trends and Data Points
1. **Early-Stage Performance (0–100 nodes)**:
- All variants show rapid growth, with `AoT (Short)` and `AoT` outperforming `AoT (Long)`.
- At 100 nodes:
- `AoT (Short)`: ~60 games
- `AoT`: ~50 games
- `AoT (Long)`: ~30 games
2. **Mid-Stage Performance (100–300 nodes)**:
- `AoT (Short)` and `AoT` maintain similar trajectories.
- `AoT (Long)` remains the weakest performer until ~300 nodes.
- At 200 nodes:
- `AoT (Short)`: ~75 games
- `AoT`: ~70 games
- `AoT (Long)`: ~40 games
3. **Late-Stage Performance (300–400 nodes)**:
- `AoT (Long)` exhibits a dramatic acceleration, overtaking all variants.
- At 300 nodes:
- `AoT (Short)`: ~80 games
- `AoT`: ~90 games
- `AoT (Long)`: ~50 games
- At 400 nodes:
- All variants converge near 100 games, with `AoT (Long)` achieving the highest value.
---
## Observations
- **Scalability**:
- `AoT (Long)` demonstrates superior scalability in high-node regimes (>300 nodes).
- **Efficiency Trade-offs**:
- `AoT (Short)` and `AoT` prioritize early-stage efficiency but plateau in later stages.
- **Convergence**:
- All variants approach 100 games by 400 nodes, suggesting asymptotic performance limits.
---
## Conclusion
The graph highlights the trade-offs between algorithmic variants:
- `AoT (Short)` and `AoT` excel in low-to-mid node regimes.
- `AoT (Long)` sacrifices early performance for late-stage scalability.
This data is critical for selecting the optimal variant based on the expected node density in deployment scenarios.