# Technical Document Extraction: Scatter Plot Analysis
## 1. Labels and Axis Titles
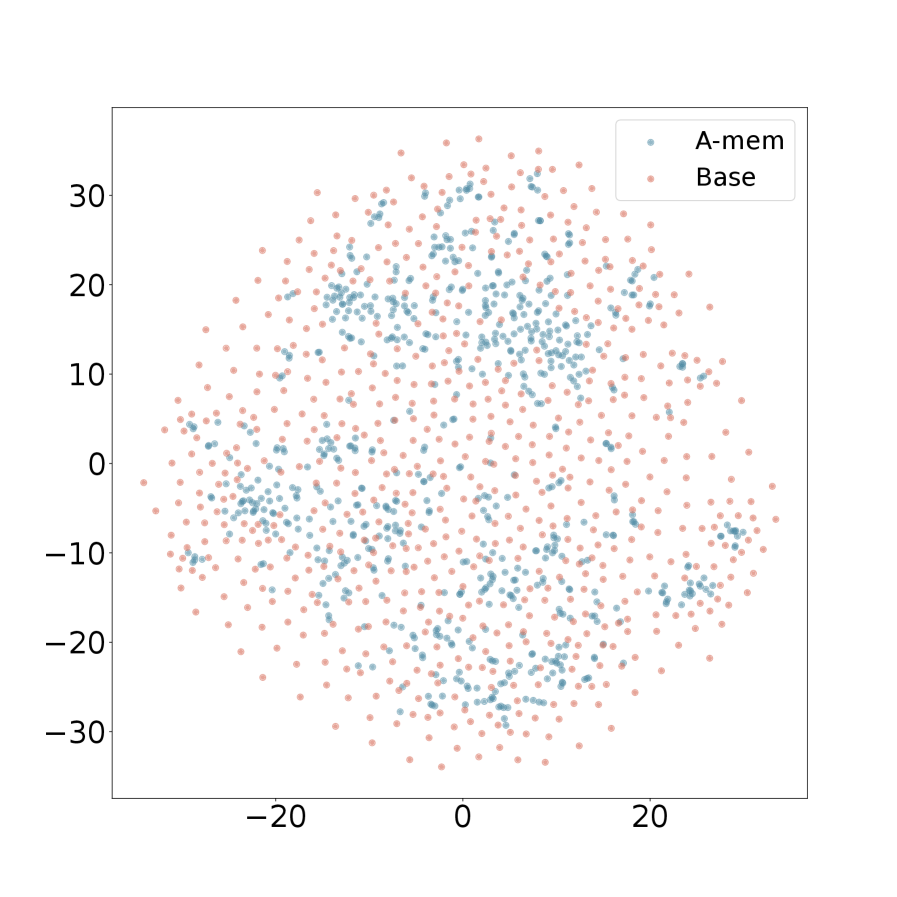
- **X-axis**: Ranges from -30 to 30 (no explicit title provided).
- **Y-axis**: Ranges from -30 to 30 (no explicit title provided).
- **Legend**: Located in the **top-right corner** of the plot.
## 2. Legend Details
- **Legend Labels**:
- `A-mem` (blue data points).
- `Base` (red data points).
- **Color Confirmation**:
- Blue (`#4682B4`) corresponds to `A-mem`.
- Red (`#CD5C5C`) corresponds to `Base`.
## 3. Data Series and Trends
### A-mem (Blue)
- **Distribution**: Slightly denser clustering near the origin (0,0), with points distributed across the entire plot.
- **Trend**: No clear directional trend; points are scattered but exhibit a mild central concentration.
- **Key Observations**:
- Higher density in the range [-10, 10] for both x and y axes.
- Points extend to the edges of the plot (e.g., x ≈ ±30, y ≈ ±30).
### Base (Red)
- **Distribution**: More uniformly spread across the plot, with no significant clustering.
- **Trend**: Evenly distributed with no discernible pattern or central tendency.
- **Key Observations**:
- Points are evenly spaced across all quadrants.
- No visible correlation between x and y values.
## 4. Spatial Grounding
- **Legend Position**: Top-right corner (coordinates: x ≈ 25, y ≈ 30).
- **Data Point Validation**:
- All blue points match `A-mem` legend label.
- All red points match `Base` legend label.
## 5. Component Isolation
- **Header**: No explicit title or header text.
- **Main Chart**:
- Scatter plot with two overlapping data series.
- Axes labeled with numerical ranges (-30 to 30).
- **Footer**: No footer text or annotations.
## 6. Additional Notes
- **Language**: All text is in English.
- **Missing Elements**: No data table, heatmap, or embedded diagrams.
- **Visual Complexity**: Simple scatter plot with two distinct data series.
## 7. Summary
The plot compares two datasets (`A-mem` and `Base`) using a scatter plot. `A-mem` shows a mild central concentration, while `Base` is uniformly distributed. No explicit trends or correlations are evident for either series.