## Scatter Plot: KMT-2016-BLG-1105 Microlensing Event
### Overview
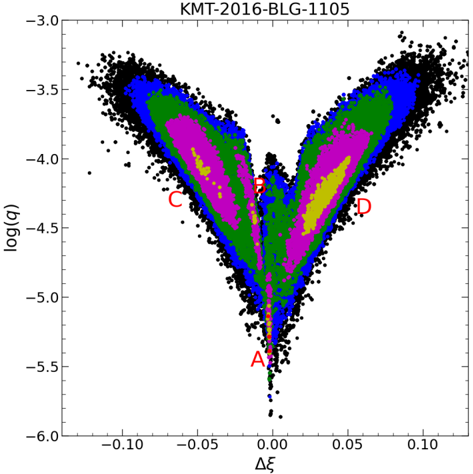
This image presents a scatter plot visualizing data from the microlensing event KMT-2016-BLG-1105. The plot displays the relationship between Δξ (Delta xi) and log(q), with data points color-coded to represent different regions or phases of the event. The plot exhibits a characteristic "bow-tie" shape commonly observed in microlensing events with binary lenses.
### Components/Axes
* **Title:** KMT-2016-BLG-1105 (located at the top-center)
* **X-axis:** Δξ (Delta xi) - ranges approximately from -0.12 to 0.12.
* **Y-axis:** log(q) - ranges approximately from -6.0 to -3.0.
* **Data Points:** Numerous black dots representing individual data measurements.
* **Color Regions:** The data points are grouped into color-coded regions, labeled A, C, and D. The colors are as follows:
* A: Dark Red
* C: Magenta/Pink
* D: Yellow/Orange
* Green: Occupies a large central portion of the plot.
* Blue/Black: Forms the upper wings of the plot.
* **Labels:** A, C, and D are labels indicating specific regions within the plot.
### Detailed Analysis
The plot shows a concentration of data points around Δξ = 0, with log(q) values ranging from approximately -5.5 to -4.0. The data points are distributed in a roughly symmetrical pattern around the vertical axis (Δξ = 0).
* **Region A (Dark Red):** Located at the bottom center of the plot, around Δξ = 0 and log(q) ≈ -5.5. This region represents the peak of the microlensing event.
* **Region C (Magenta/Pink):** Situated on the left side of the plot, with Δξ values ranging from approximately -0.10 to -0.02 and log(q) values ranging from approximately -3.5 to -4.5.
* **Region D (Yellow/Orange):** Located on the right side of the plot, mirroring Region C, with Δξ values ranging from approximately 0.02 to 0.10 and log(q) values ranging from approximately -3.5 to -4.5.
* **Green Region:** Occupies the central area of the "bow-tie" shape, extending from Δξ ≈ -0.05 to 0.05 and log(q) ≈ -4.0 to -5.0.
* **Blue/Black Regions:** Form the upper wings of the plot, with Δξ values ranging from approximately -0.12 to 0.12 and log(q) values ranging from approximately -3.0 to -3.5. These regions represent the wings of the microlensing light curve.
The data points are densely packed within each colored region, indicating a high number of observations in those areas. The distribution of points suggests a smooth transition between the different regions.
### Key Observations
* The "bow-tie" shape is a strong indicator of a binary lens system.
* The symmetry of the plot around Δξ = 0 suggests a symmetrical lens configuration.
* The concentration of points in Region A indicates the peak magnification of the microlensing event.
* The distinct color-coded regions likely correspond to different phases or configurations of the binary lens system.
### Interpretation
This plot represents the light curve of a microlensing event caused by a binary lens system. Microlensing occurs when a foreground star passes in front of a background star, temporarily magnifying the background star's light. When the foreground star is actually a binary system, the resulting light curve exhibits characteristic features, such as the "bow-tie" shape observed here.
The different color-coded regions likely represent different configurations of the binary lens system during the event. Region A corresponds to the peak magnification, while Regions C and D represent the wings of the light curve, where the magnification is lower. The green region represents intermediate magnification levels.
The symmetry of the plot suggests that the binary lens system is aligned in a way that produces a symmetrical magnification pattern. The data suggests the presence of two distinct lenses within the foreground system, causing the observed distortions in the light curve. The log(q) parameter represents the mass ratio of the two lenses. The shape and distribution of the data points provide valuable information about the masses, separation, and relative positions of the two lenses. This type of analysis is crucial for detecting and characterizing exoplanets orbiting stars in binary systems.