## Scatter Plot: KMT-2016-BLG-1105 Data Distribution
### Overview
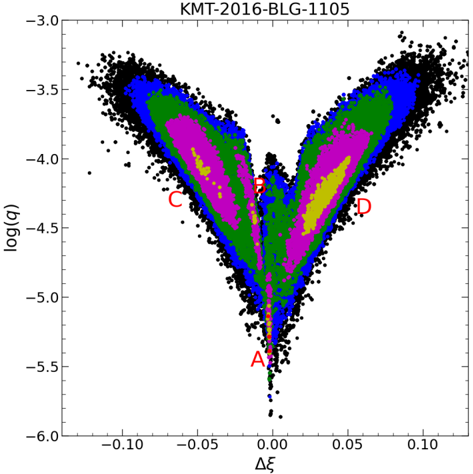
The image depicts a scatter plot with a color gradient density map, showing the distribution of data points across two variables: Δξ (horizontal axis) and log(q) (vertical axis). The plot includes labeled regions (A, B, C, D) and a color-coded density scale.
### Components/Axes
- **X-axis (Δξ)**: Ranges from -0.10 to 0.10, labeled with increments of 0.05.
- **Y-axis (log(q))**: Ranges from -6.0 to -3.0, labeled with increments of 0.5.
- **Legend**: A gradient scale from black (low density) to purple (high density), though no explicit legend box is visible.
- **Labels**: Red text annotations for regions A (bottom center), B (upper left), C (upper right), and D (lower right).
### Detailed Analysis
- **Data Distribution**:
- The majority of data points form a dense, V-shaped cluster centered around Δξ ≈ 0 and log(q) ≈ -4.5.
- Density decreases radially outward, with the highest concentration (purple) near the center and the lowest (black) in the outer regions.
- Points in the tails (Δξ < -0.05 and Δξ > 0.05) are sparse and predominantly black.
- **Labeled Regions**:
- **A**: Located at Δξ ≈ 0, log(q) ≈ -5.5 (deepest part of the V).
- **B**: Clustered around Δξ ≈ -0.05, log(q) ≈ -3.5 (upper left).
- **C**: Clustered around Δξ ≈ 0.05, log(q) ≈ -3.5 (upper right).
- **D**: Located at Δξ ≈ 0.05, log(q) ≈ -4.5 (lower right, overlapping with the V’s right lobe).
### Key Observations
1. **Bifurcation Pattern**: The V-shape suggests two distinct populations or regimes separated by Δξ ≈ 0.
2. **Density Gradient**: The purple-to-black gradient indicates a sharp drop-off in density away from the central cluster.
3. **Asymmetry**: The upper lobes (B and C) are more extended horizontally than the lower lobes (A and D).
4. **Outliers**: A few isolated points exist beyond Δξ = ±0.10, but these are rare.
### Interpretation
The plot likely represents a physical or statistical relationship where Δξ and log(q) are correlated. The V-shape could indicate a bifurcation in the system (e.g., two distinct mass ranges or luminosity classes in astrophysics). The labeled regions (A-D) may correspond to specific classifications or observational regimes. The density gradient highlights the central cluster as the dominant population, while the upper lobes (B and C) suggest secondary groupings at higher log(q) values. The asymmetry between upper and lower lobes warrants further investigation into potential biases or observational constraints.
*Note: Without additional context (e.g., the definition of Δξ and log(q)), the interpretation remains speculative but grounded in the visual patterns observed.*