## Line Chart: ARC Challenge Accuracy vs. Test-Time Compute Recurrence
### Overview
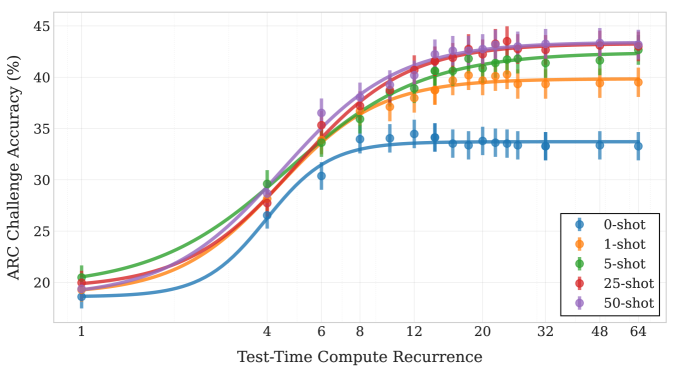
The image is a line chart displaying the relationship between "Test-Time Compute Recurrence" (x-axis) and "ARC Challenge Accuracy (%)" (y-axis) for different "shot" configurations (0-shot, 1-shot, 5-shot, 25-shot, and 50-shot). The chart shows how accuracy changes with increasing compute recurrence for each configuration. Error bars are present on each data point.
### Components/Axes
* **X-axis:** "Test-Time Compute Recurrence". The scale is logarithmic, with marked values at 1, 4, 6, 8, 12, 20, 32, 48, and 64.
* **Y-axis:** "ARC Challenge Accuracy (%)". The scale ranges from 20 to 45, with tick marks at intervals of 5.
* **Legend:** Located in the bottom-right corner, the legend identifies each line by its color and "shot" configuration:
* Blue: 0-shot
* Orange: 1-shot
* Green: 5-shot
* Red: 25-shot
* Purple: 50-shot
### Detailed Analysis
* **0-shot (Blue):** The line starts at approximately 19% accuracy at a recurrence of 1. It increases to approximately 34% accuracy by a recurrence of 8, then plateaus around 34% for higher recurrence values.
* **1-shot (Orange):** The line starts at approximately 20% accuracy at a recurrence of 1. It increases to approximately 40% accuracy by a recurrence of 12, then plateaus around 40% for higher recurrence values.
* **5-shot (Green):** The line starts at approximately 21% accuracy at a recurrence of 1. It increases to approximately 42% accuracy by a recurrence of 12, then plateaus around 42% for higher recurrence values.
* **25-shot (Red):** The line starts at approximately 20% accuracy at a recurrence of 1. It increases to approximately 43% accuracy by a recurrence of 12, then plateaus around 43% for higher recurrence values.
* **50-shot (Purple):** The line starts at approximately 20% accuracy at a recurrence of 1. It increases to approximately 44% accuracy by a recurrence of 12, then plateaus around 44% for higher recurrence values.
### Key Observations
* All configurations except 0-shot show a significant increase in accuracy as the Test-Time Compute Recurrence increases from 1 to approximately 12.
* After a recurrence of 12, the accuracy for 1-shot, 5-shot, 25-shot, and 50-shot configurations plateaus.
* The 0-shot configuration plateaus at a significantly lower accuracy than the other configurations.
* The 50-shot configuration consistently achieves the highest accuracy among all configurations.
### Interpretation
The data suggests that increasing the Test-Time Compute Recurrence significantly improves the ARC Challenge Accuracy, especially for configurations with a few shots (1-shot, 5-shot, 25-shot, and 50-shot). The 0-shot configuration benefits less from increased recurrence, indicating that some initial learning (shots) is crucial for leveraging the benefits of increased compute time. The diminishing returns observed after a recurrence of 12 suggest an optimal point beyond which further increases in compute time provide minimal gains in accuracy. The 50-shot configuration consistently outperforming the others indicates that more initial learning leads to better performance overall.