## Line Chart: ARC Challenge Accuracy vs. Test-Time Compute Recurrence
### Overview
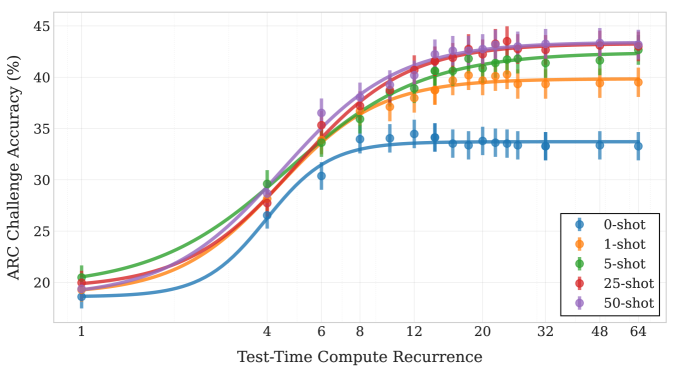
This chart displays the relationship between Test-Time Compute Recurrence and ARC Challenge Accuracy for different numbers of shots (0-shot, 1-shot, 5-shot, 25-shot, and 50-shot). The chart uses line plots with error bars to represent the accuracy at each recurrence level.
### Components/Axes
* **X-axis:** Test-Time Compute Recurrence. Scale is logarithmic, with markers at 1, 2, 4, 6, 8, 12, 20, 32, 48, and 64.
* **Y-axis:** ARC Challenge Accuracy (%). Scale ranges from approximately 18% to 45%.
* **Legend:** Located in the bottom-right corner. Contains the following labels and corresponding colors:
* 0-shot: Light Blue
* 1-shot: Orange
* 5-shot: Green
* 25-shot: Red
* 50-shot: Purple
* **Data Series:** Five lines, each representing a different number of shots. Each line is accompanied by error bars indicating the variance in accuracy.
### Detailed Analysis
* **0-shot (Light Blue):** The line starts at approximately 20% accuracy at a recurrence of 1. It increases slightly to around 23% at a recurrence of 4, then plateaus around 32-33% for the remainder of the recurrence values. Error bars are relatively consistent across the range, indicating stable variance.
* **1-shot (Orange):** The line begins at approximately 20% accuracy at a recurrence of 1. It increases steadily to around 38% at a recurrence of 12, then continues to increase, reaching approximately 42% at a recurrence of 64. Error bars are larger at lower recurrence values, decreasing as recurrence increases.
* **5-shot (Green):** The line starts at approximately 20% accuracy at a recurrence of 1. It increases rapidly, reaching around 36% at a recurrence of 8, and then continues to increase, reaching approximately 42% at a recurrence of 64. Error bars are similar to the 1-shot line, larger at lower recurrence values.
* **25-shot (Red):** The line starts at approximately 20% accuracy at a recurrence of 1. It increases very rapidly, reaching around 40% at a recurrence of 8, and then continues to increase, reaching approximately 44% at a recurrence of 64. Error bars are relatively small and consistent.
* **50-shot (Purple):** The line starts at approximately 20% accuracy at a recurrence of 1. It increases very rapidly, reaching around 42% at a recurrence of 8, and then continues to increase, reaching approximately 44-45% at a recurrence of 64. Error bars are the smallest of all the lines, indicating the most consistent accuracy.
All lines show an initial steep increase in accuracy as Test-Time Compute Recurrence increases from 1 to 8. The rate of increase slows down as recurrence increases beyond 8, with the lines tending to plateau.
### Key Observations
* The 0-shot performance remains relatively low and stable across all recurrence values.
* Increasing the number of shots significantly improves accuracy, especially at lower recurrence values.
* The 25-shot and 50-shot lines achieve the highest accuracy, with the 50-shot line showing the most consistent performance (smallest error bars).
* The benefit of increasing recurrence diminishes as the recurrence value increases, particularly for the higher-shot lines.
### Interpretation
The data suggests that Test-Time Compute Recurrence is a crucial factor in improving the accuracy of the ARC Challenge, particularly when combined with few-shot learning. The more shots provided, the greater the benefit of increasing recurrence, up to a point. The plateauing of the lines at higher recurrence values indicates that there is a limit to the improvement that can be achieved by simply increasing recurrence. The 0-shot performance highlights the importance of providing some examples (shots) to the model for effective learning. The consistent performance of the 50-shot line suggests that this number of shots provides a good balance between accuracy and stability. The logarithmic scale of the x-axis indicates that the initial gains in accuracy are more significant than gains at higher recurrence values. This could be due to the model quickly learning the basic patterns in the data at lower recurrence values, and then requiring more computational effort to refine its understanding.