## Line Graph: ARC Challenge Accuracy vs. Test-Time Compute Recurrence
### Overview
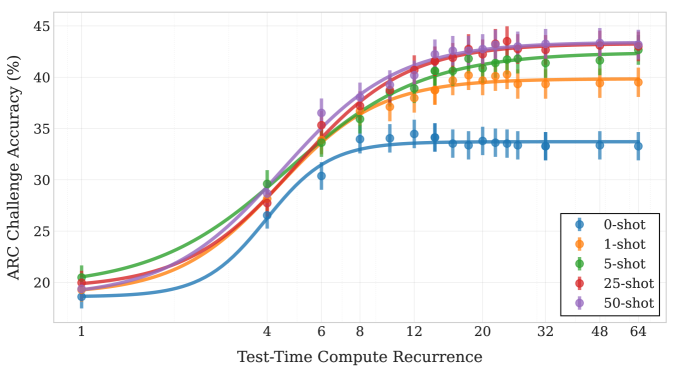
The image depicts a line graph comparing ARC Challenge Accuracy (%) across five different "shot" configurations (0-shot, 1-shot, 5-shot, 25-shot, 50-shot) as a function of Test-Time Compute Recurrence (x-axis: 1–64). The graph shows five colored lines with error bars, converging toward higher accuracy values as compute recurrence increases.
### Components/Axes
- **X-axis**: Test-Time Compute Recurrence (logarithmic scale: 1, 4, 6, 8, 12, 20, 32, 48, 64)
- **Y-axis**: ARC Challenge Accuracy (%) (linear scale: 15–45%)
- **Legend**: Located in the bottom-right corner, mapping colors to shot configurations:
- Blue: 0-shot
- Orange: 1-shot
- Green: 5-shot
- Red: 25-shot
- Purple: 50-shot
- **Error Bars**: Present for all data points, indicating variability in measurements.
### Detailed Analysis
1. **0-shot (Blue Line)**:
- Starts at ~18% accuracy at x=1.
- Gradually increases to ~33% at x=64.
- Error bars remain relatively small (~±1–2%).
2. **1-shot (Orange Line)**:
- Begins at ~19% at x=1.
- Rises to ~39% at x=64.
- Error bars slightly larger than 0-shot (~±2–3%).
3. **5-shot (Green Line)**:
- Starts at ~20% at x=1.
- Peaks at ~42% at x=64.
- Error bars moderate (~±2–4%).
4. **25-shot (Red Line)**:
- Initial value ~21% at x=1.
- Reaches ~43% at x=64.
- Error bars similar to 5-shot (~±3–5%).
5. **50-shot (Purple Line)**:
- Starts at ~22% at x=1.
- Stabilizes near ~43% at x=64.
- Error bars largest (~±4–6%).
**Trend Verification**:
- All lines exhibit upward trends, with steeper increases at lower compute recurrence values.
- Lines converge toward ~42–43% accuracy at x=64, suggesting diminishing returns for higher shot counts beyond this point.
- 0-shot and 1-shot lines remain consistently below others, indicating lower performance with fewer shots.
### Key Observations
- **Diminishing Returns**: Higher shot configurations (25-shot, 50-shot) achieve near-identical accuracy at x=64 (~43%), suggesting limited benefit from additional shots beyond 25.
- **Compute Recurrence Threshold**: Significant accuracy improvements occur between x=1 and x=12 across all configurations.
- **Error Bar Variability**: Larger error bars for 50-shot suggest greater experimental uncertainty compared to lower shot counts.
### Interpretation
The data demonstrates that increasing the number of "shots" (iterations or examples) improves ARC Challenge Accuracy, particularly at lower compute recurrence values. However, beyond x=12, accuracy plateaus, with 25-shot and 50-shot configurations achieving similar performance. This implies that while more shots enhance performance, there is a practical limit to gains from additional iterations. The 0-shot and 1-shot configurations lag significantly, highlighting the importance of iterative refinement in this context. The convergence of lines at high compute recurrence suggests that optimizing for moderate shot counts (e.g., 25-shot) may be more efficient than pursuing higher shot counts with diminishing returns.