## Line Chart: HellaSwag Benchmark Performance by Model Iteration
### Overview
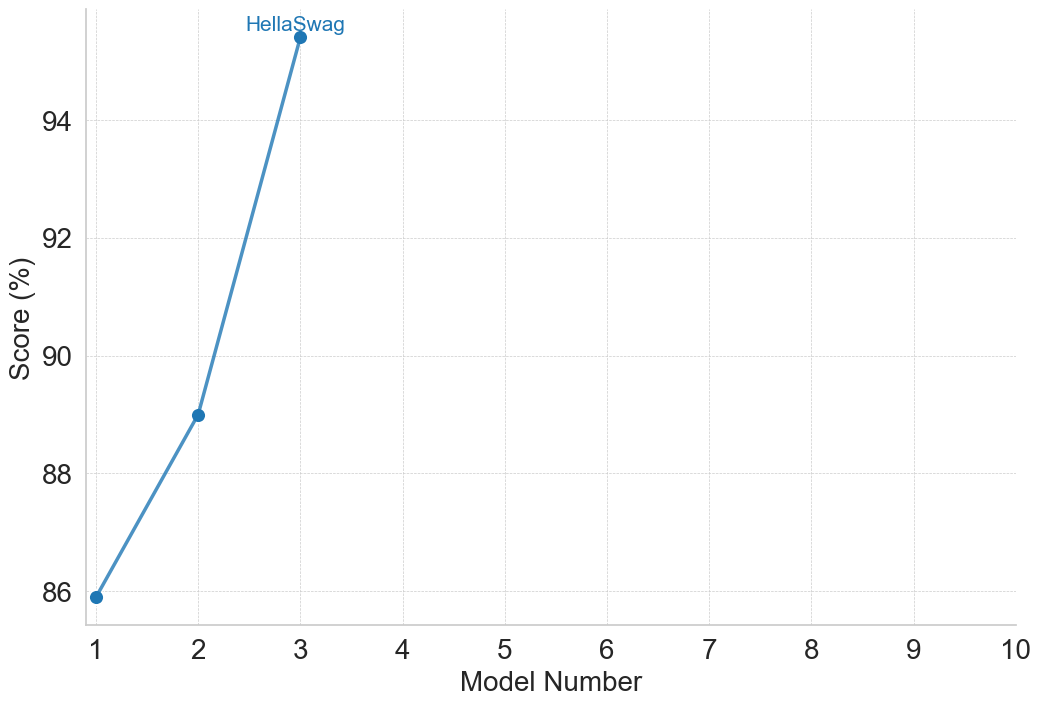
This image is a line chart displaying the performance scores of a specific benchmark, identified as "HellaSwag," across sequential model iterations. The chart plots a single data series consisting of three data points connected by straight line segments, showing a clear upward trajectory in performance. The language used in the chart is entirely English.
### Components/Axes
**Component Isolation & Spatial Grounding:**
* **Y-Axis (Left):** Labeled "Score (%)". The axis features major tick marks and corresponding faint, dotted horizontal grid lines at intervals of 2. The visible labels are 86, 88, 90, 92, and 94.
* **X-Axis (Bottom):** Labeled "Model Number". The axis features major tick marks and corresponding faint, dotted vertical grid lines at intervals of 1. The visible labels range from 1 to 10 (1, 2, 3, 4, 5, 6, 7, 8, 9, 10).
* **Data Series (Main Chart Area):** A single solid blue line connecting three solid blue circular markers. The data points are located in the left-hand portion of the chart area (spanning x=1 to x=3).
* **Annotation (Top Left):** The text "HellaSwag" is written in blue, matching the color of the data line. It is positioned directly above the third and highest data point. There is no separate legend box; this annotation serves as the series label.
### Detailed Analysis
**Trend Verification:**
The visual trend of the single blue line slopes upward from left to right. The slope between the first and second points is positive and steep. The slope between the second and third points is also positive and visibly steeper than the first segment, indicating an accelerating rate of improvement.
**Data Point Extraction:**
*Note: Values are approximate based on visual interpolation between grid lines.*
* **Data Point 1:**
* X-axis (Model Number): Exactly 1
* Y-axis (Score %): The point sits just barely below the 86 grid line.
* *Approximate Value: ~85.9%*
* **Data Point 2:**
* X-axis (Model Number): Exactly 2
* Y-axis (Score %): The point sits exactly halfway between the 88 and 90 grid lines.
* *Approximate Value: ~89.0%*
* **Data Point 3:**
* X-axis (Model Number): Exactly 3
* Y-axis (Score %): The point sits above the highest labeled grid line (94). Assuming the next grid line would be 96, it sits slightly above the halfway mark between 94 and 96.
* *Approximate Value: ~95.3%*
### Key Observations
1. **Incomplete X-Axis Utilization:** While the x-axis extends to Model Number 10, data is only provided for Models 1, 2, and 3. The right-hand 70% of the chart is entirely empty space.
2. **Accelerating Gains:** The absolute gain between Model 1 and 2 is roughly 3.1 percentage points. The absolute gain between Model 2 and 3 is roughly 6.3 percentage points. The performance increase is non-linear and accelerating.
3. **High Baseline:** The chart's y-axis does not start at zero; it begins near 86%, indicating that even the first model iteration performed at a relatively high level on this specific metric.
### Interpretation
* **What the data suggests:** The chart demonstrates rapid, successive improvements in a machine learning or AI model's ability to perform the "HellaSwag" benchmark (a common test for evaluating commonsense natural language inference). Each new version of the model is significantly better than the last.
* **Relationship of elements:** The matching blue color of the "HellaSwag" text and the data line explicitly links the performance metric to the specific benchmark being tested, acting as an integrated legend.
* **Reading between the lines (Peircean investigative):** The presence of an x-axis extending to 10, despite only having data up to 3, strongly implies that this is an ongoing project or a standardized reporting template. It suggests the developers plan to release or evaluate up to 10 models in this series, and this chart represents a snapshot of early progress. Furthermore, the accelerating jump in performance between Model 2 and Model 3 (~6.3% vs ~3.1%) suggests that a significant architectural change, a massive increase in training compute/data, or a breakthrough in methodology occurred between those specific iterations, rather than just incremental tuning.