# Technical Document Extraction: Line Chart Analysis
## Chart Overview
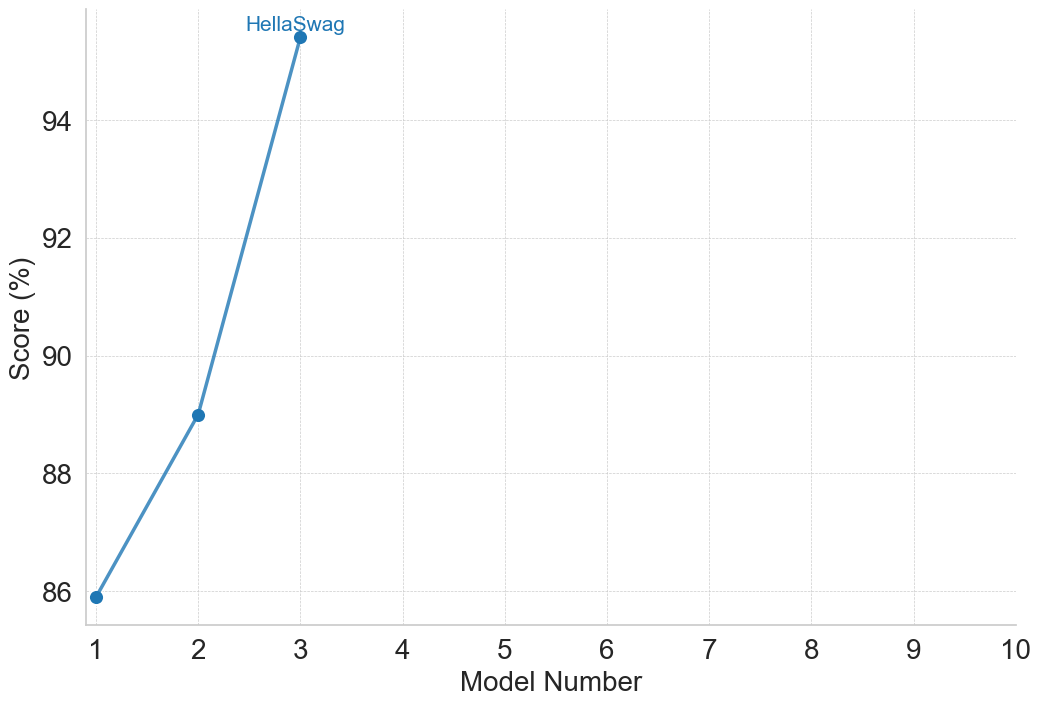
The image depicts a **line chart** with a single data series represented by a **blue line**. The chart includes grid lines, axis labels, and a textual annotation. Below is a detailed breakdown of all textual and structural components.
---
### **1. Axis Labels and Markers**
- **X-Axis (Horizontal):**
- **Title:** "Model Number"
- **Range:** 1 to 10 (integer increments)
- **Tick Marks:** Visible at every integer value (1, 2, 3, ..., 10).
- **Y-Axis (Vertical):**
- **Title:** "Score (%)"
- **Range:** 86% to 96% (increments of 2%)
- **Tick Marks:** Visible at 86%, 88%, 90%, 92%, 94%, 96%.
---
### **2. Data Series**
- **Line Color:** Blue (matches legend annotation).
- **Data Points:**
- **Point 1:** (x=1, y=86%)
- Positioned at the bottom-left of the chart.
- **Point 2:** (x=2, y=89%)
- Positioned midway between x=1 and x=3.
- **Point 3:** (x=3, y=95%)
- Positioned at the top of the chart, labeled "HellaSwag".
---
### **3. Annotations**
- **Text Label:** "HellaSwag"
- Placed near the highest data point (x=3, y=95%).
- No legend box is present; the label acts as an inline annotation.
---
### **4. Chart Structure**
- **Background:** White with light gray grid lines (dotted, both horizontal and vertical).
- **Line Style:** Solid blue line connecting all data points.
- **Trend:**
- The line exhibits a **steep upward slope** from x=1 to x=3.
- **Key Trend Verification:**
- From x=1 (86%) to x=2 (89%): Moderate increase (+3%).
- From x=2 (89%) to x=3 (95%): Sharp increase (+6%).
---
### **5. Spatial Grounding**
- **Legend:** Not explicitly present as a box. The label "HellaSwag" is spatially grounded near the highest data point (x=3, y=95%).
- **Color Consistency:** The blue line matches the implied legend color for the data series.
---
### **6. Missing Elements**
- **No Data Table:** The chart does not include an embedded table; data is represented visually.
- **No Secondary Axes or Subplots:** The chart is a single-axis line plot.
---
### **7. Summary of Key Trends**
- The score increases monotonically with model number.
- The largest improvement occurs between model numbers 2 and 3 (+6 percentage points).
- The highest score (95%) is achieved at model number 3, annotated as "HellaSwag".
---
### **8. Final Notes**
- The chart focuses on a small subset of model numbers (1–3) despite the x-axis extending to 10.
- No additional textual or numerical data is present beyond the described components.