## Bayesian Network Diagram: Box to E1-E5 to E1 T - E5 T
### Overview
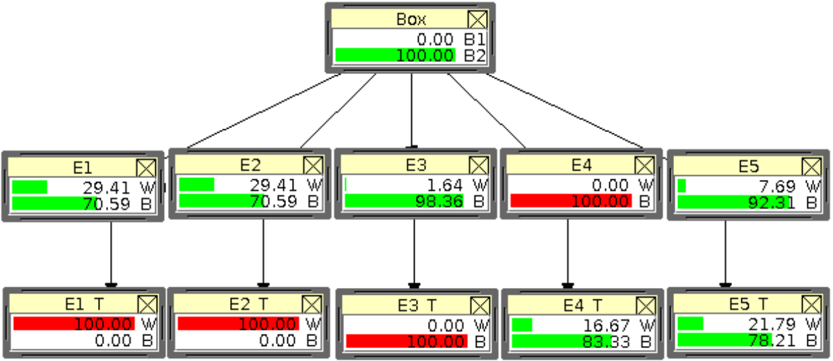
The image depicts a Bayesian network diagram. It shows probabilistic relationships between a "Box" node, five intermediate nodes (E1 to E5), and five terminal nodes (E1 T to E5 T). Each node displays two values, labeled "W" and "B", along with a colored bar indicating the proportion of each value. The colors are green and red.
### Components/Axes
* **Nodes:**
* "Box" (top node)
* "E1", "E2", "E3", "E4", "E5" (intermediate nodes)
* "E1 T", "E2 T", "E3 T", "E4 T", "E5 T" (terminal nodes)
* **Values within each node:**
* "W": Represents one state or outcome. The bar is green.
* "B": Represents another state or outcome. The bar is red.
* **Connections:** Arrows indicate the probabilistic dependencies. The "Box" node is connected to all "E" nodes, and each "E" node is connected to its corresponding "E T" node.
### Detailed Analysis
**Node: Box**
* B1: 0.00
* B2: 100.00 (Green bar is full)
**Node: E1**
* W: 29.41 (Green bar is approximately 30% full)
* B: 70.59 (Red bar is approximately 70% full)
**Node: E2**
* W: 29.41 (Green bar is approximately 30% full)
* B: 70.59 (Red bar is approximately 70% full)
**Node: E3**
* W: 1.64 (Green bar is almost empty)
* B: 98.36 (Red bar is almost full)
**Node: E4**
* W: 0.00 (Green bar is empty)
* B: 100.00 (Red bar is full)
**Node: E5**
* W: 7.69 (Green bar is almost empty)
* B: 92.31 (Red bar is almost full)
**Node: E1 T**
* W: 100.00 (Red bar is full)
* B: 0.00 (Green bar is empty)
**Node: E2 T**
* W: 100.00 (Red bar is full)
* B: 0.00 (Green bar is empty)
**Node: E3 T**
* W: 0.00 (Green bar is empty)
* B: 100.00 (Red bar is full)
**Node: E4 T**
* W: 16.67 (Green bar is approximately 15% full)
* B: 83.33 (Red bar is approximately 85% full)
**Node: E5 T**
* W: 21.79 (Green bar is approximately 20% full)
* B: 78.21 (Red bar is approximately 80% full)
### Key Observations
* The "Box" node is entirely biased towards "B2".
* Nodes E1 and E2 have similar distributions, with a higher probability for "B" than "W".
* Nodes E3, E4, and E5 are heavily biased towards "B".
* Nodes E1 T and E2 T are entirely biased towards "W".
* Node E3 T is entirely biased towards "B".
* Nodes E4 T and E5 T have a higher probability for "B" than "W".
### Interpretation
The Bayesian network represents a system where the "Box" node influences the probabilities of the "E" nodes, which in turn influence the "E T" nodes. The values "W" and "B" likely represent different states or outcomes within the system. The diagram suggests that the initial state of the "Box" (heavily biased towards "B2") leads to a higher probability of "B" in most of the "E" nodes. However, the "E T" nodes show a mixed response, with E1 T and E2 T being completely opposite to their parent nodes (E1 and E2), while E3 T is similar to E3. E4 T and E5 T show a shift towards "B" compared to E4 and E5. This indicates complex relationships and dependencies within the system, where the initial state of the "Box" does not directly translate to the final states of the "E T" nodes. The network could represent a decision-making process, a physical system, or any other scenario where probabilistic relationships are important.