## Diagram: Box and Element Distribution
### Overview
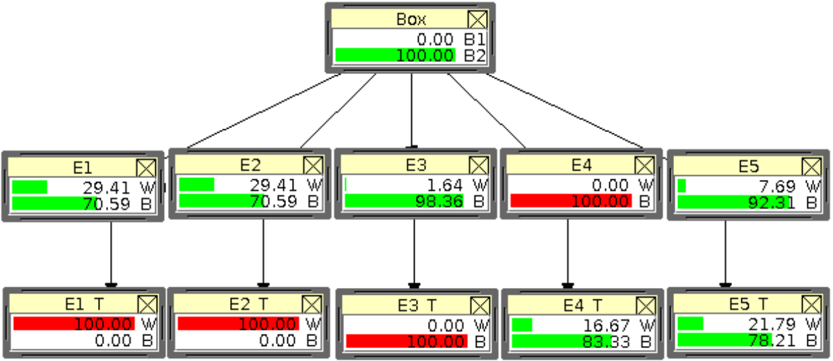
The image depicts a hierarchical diagram representing a "Box" divided into five "E" elements (E1-E5), each further divided into a "T" sub-element (E1 T - E5 T). Each box displays two numerical values labeled "W" and "B", likely representing weights or proportions. The diagram illustrates a distribution or allocation of values across these hierarchical levels.
### Components/Axes
The diagram consists of three levels:
1. **Top Level:** A single box labeled "Box".
2. **Middle Level:** Five boxes labeled "E1" through "E5".
3. **Bottom Level:** Five boxes labeled "E1 T" through "E5 T".
Each box contains two values, labeled "W" (in green) and "B" (in red). Each box also has a small "X" icon in the top-right corner. Lines connect the boxes, indicating a hierarchical relationship.
### Detailed Analysis or Content Details
**Box (Top Level):**
* W: 0.00
* B: 100.00
**E1 (Middle Level):**
* W: 29.41
* B: 70.59
**E2 (Middle Level):**
* W: 29.41
* B: 70.59
**E3 (Middle Level):**
* W: 1.64
* B: 98.36
**E4 (Middle Level):**
* W: 0.00
* B: 100.00
**E5 (Middle Level):**
* W: 7.69
* B: 92.31
**E1 T (Bottom Level):**
* W: 100.00
* B: 0.00
**E2 T (Bottom Level):**
* W: 100.00
* B: 0.00
**E3 T (Bottom Level):**
* W: 0.00
* B: 100.00
**E4 T (Bottom Level):**
* W: 16.67
* B: 83.33
**E5 T (Bottom Level):**
* W: 21.79
* B: 78.21
### Key Observations
* The "Box" has 0% W and 100% B.
* E1 and E2 have similar W and B values (approximately 29% and 71% respectively).
* E3 has a very low W value (1.64%) and a high B value (98.36%).
* E4 has 0% W and 100% B.
* E5 has a relatively low W value (7.69%) and a high B value (92.31%).
* The "T" elements generally have the opposite distribution of "W" and "B" compared to their parent "E" elements. For example, E1 has high W and low B, while E1 T has high W and low B.
* The "X" icon appears in all boxes, suggesting a possible control or status indicator.
### Interpretation
This diagram likely represents a resource allocation or distribution system. The "Box" represents the total resource, and the "E" elements represent different categories or components. The "W" and "B" values could represent weights, percentages, or quantities of a specific resource allocated to each category. The "T" elements might represent sub-categories or further divisions within each "E" element.
The data suggests that the resource is primarily allocated to "B" at the top level. However, the distribution among the "E" elements is varied, with E3 and E4 being heavily weighted towards "B", while E1, E2, and E5 have a more balanced distribution. The "T" elements seem to represent a reversal of the "W" and "B" allocation within each "E" element, potentially indicating a transformation or redistribution process.
The outlier is E3, which has a very low "W" value and a very high "B" value, suggesting it is a special case or a significant sink for the "B" resource. The "X" icon could indicate a status flag, such as "enabled" or "active". Without further context, it's difficult to determine the exact meaning of "W" and "B", but the diagram clearly illustrates a hierarchical distribution of resources with varying allocations across different categories.