## Hierarchical Status Diagram: Resource Allocation Tree
### Overview
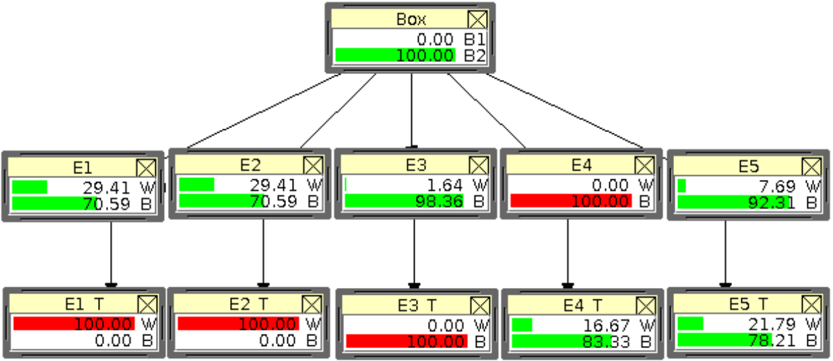
The image displays a hierarchical tree diagram representing a resource allocation or status monitoring system. It consists of three levels: a single parent node at the top, five child nodes in the middle, and five corresponding terminal nodes at the bottom. Each node is a rectangular box containing a label, numerical values, and a color-coded status bar. Lines connect the parent to its children and each child to its terminal node.
### Components/Axes
The diagram is structured as a tree with three distinct tiers:
1. **Top Node (Root):** A single box labeled "Box".
2. **Middle Tier (Children):** Five boxes labeled E1, E2, E3, E4, and E5.
3. **Bottom Tier (Terminals):** Five boxes labeled E1 T, E2 T, E3 T, E4 T, and E5 T.
**Node Structure:** Each box contains:
* A label in the top-left corner (e.g., "Box", "E1").
* A small "X" icon in the top-right corner.
* Two rows of data below the label.
* A horizontal color bar on the left side of each data row.
**Legend/Color Key (Inferred):** There is no separate legend. The color bars within each data row act as a visual key:
* **Green Bar:** Associated with a value labeled "B".
* **Red Bar:** Associated with a value labeled "B" in some nodes, indicating a different state (e.g., depleted, critical, or inverted).
* **White/Empty Bar:** Associated with a value labeled "W".
### Detailed Analysis
**Top Node: "Box"**
* **Position:** Top-center of the diagram.
* **Data Row 1:** Value `0.00`, Label `B1`. Bar is white/empty.
* **Data Row 2:** Value `100.00`, Label `B2`. Bar is solid green.
**Middle Tier (Children of "Box"):**
* **E1 (Leftmost):**
* Row 1: `29.41 W` (white bar).
* Row 2: `70.59 B` (green bar).
* **E2:**
* Row 1: `29.41 W` (white bar).
* Row 2: `70.59 B` (green bar).
* **E3:**
* Row 1: `1.64 W` (white bar).
* Row 2: `98.36 B` (green bar).
* **E4:**
* Row 1: `0.00 W` (white bar).
* Row 2: `100.00 B` (red bar).
* **E5 (Rightmost):**
* Row 1: `7.69 W` (white bar).
* Row 2: `92.31 B` (green bar).
**Bottom Tier (Terminal Nodes):**
* **E1 T (Child of E1):**
* Row 1: `100.00 W` (red bar).
* Row 2: `0.00 B` (white bar).
* **E2 T (Child of E2):**
* Row 1: `100.00 W` (red bar).
* Row 2: `0.00 B` (white bar).
* **E3 T (Child of E3):**
* Row 1: `0.00 W` (white bar).
* Row 2: `100.00 B` (red bar).
* **E4 T (Child of E4):**
* Row 1: `16.67 W` (green bar).
* Row 2: `83.33 B` (green bar).
* **E5 T (Child of E5):**
* Row 1: `21.79 W` (green bar).
* Row 2: `78.21 B` (green bar).
### Key Observations
1. **Value Pairs Sum to 100:** In every node, the two values (W and B) sum to exactly 100.00, suggesting they represent complementary percentages of a whole.
2. **Color-State Correlation:**
* A **green bar** for a "B" value appears to indicate a healthy, active, or positive state (e.g., E1's 70.59 B).
* A **red bar** for a "B" value (E4, E3 T) or a "W" value (E1 T, E2 T) indicates a critical, depleted, or inverted state.
* A **white bar** appears to be a neutral or baseline state.
3. **Parent-Child Relationship:** The parent "Box" has `B1=0.00` and `B2=100.00`. Its children (E1-E5) all have a "B" value (green, except E4's red) that is less than 100, and a corresponding "W" value.
4. **Terminal Node Transformation:** The terminal nodes ("T") show a significant state change from their parent nodes:
* E1/E2: High "B" (green) becomes `0.00 B` (white); "W" becomes `100.00 W` (red).
* E3: High "B" (green) becomes `100.00 B` (red); "W" becomes `0.00 W`.
* E4: Already critical (`100.00 B` red) transforms to a mixed state (`83.33 B` green, `16.67 W` green).
* E5: High "B" (green) transforms to a slightly lower "B" (`78.21 B` green) and higher "W" (`21.79 W` green).
### Interpretation
This diagram likely models a **resource distribution and consumption system**. The "Box" represents a total pool (100% B2). This pool is allocated to five subsystems (E1-E5), each consuming a certain percentage ("B") of the resource, leaving the remainder as free or unused capacity ("W").
The color coding provides a real-time health status:
* **Green "B":** Resource is being utilized normally.
* **Red "B":** Resource is fully consumed or in a critical state (E4).
* **Red "W":** The complementary capacity is fully utilized or in a critical state (E1 T, E2 T).
The terminal nodes ("T") represent the **outcome or next state** after a process, transaction, or time period. The transformation is notable:
* For E1 and E2, the process completely inverts their state, consuming all remaining capacity ("W" becomes 100% and red).
* For E3, the process consumes the last of the resource, pushing it to a critical state.
* For E4, already critical, the process appears to have a restorative effect, moving it to a healthy, mixed state.
* For E5, the process results in a moderate, healthy consumption increase.
The system demonstrates **dynamic rebalancing**. Nodes in critical states (E4) or those that fully deplete their capacity (E1 T, E2 T, E3 T) are flagged in red, while nodes operating within normal parameters are green. The diagram is a snapshot for monitoring system load, efficiency, and identifying points of failure or saturation.