## Hierarchical Resource Allocation Diagram: Box Distribution to Elements E1-E5
### Overview
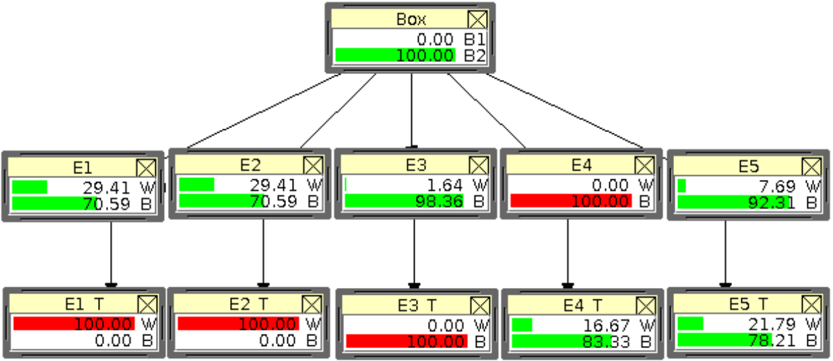
The diagram illustrates a hierarchical distribution of resources from a central "Box" to five elements (E1-E5). Each element splits into two sub-components labeled "T" (top) and "B" (bottom), with values represented as percentages. The system uses a color-coded legend: green for "W" (likely "Work" or "Weight") and red for "B" (likely "Balance" or "Burden"). All values sum to 100% within their respective groups.
### Components/Axes
1. **Central Box**:
- Positioned at the top center.
- Contains two values:
- `0.00 B1` (red, unfilled)
- `100.00 B2` (green, filled)
- Acts as the root node for all elements.
2. **Elements (E1-E5)**:
- Five branches stemming from the Box.
- Each element has:
- **Top Section (T)**: Green bar (W) + Red bar (B)
- **Bottom Section (T)**: Green bar (W) + Red bar (B)
- All T and B sections sum to 100% within their element.
3. **Legend**:
- Located at the top-right corner.
- Green = "W" (Work/Benefit)
- Red = "B" (Balance/Burden)
### Detailed Analysis
#### Central Box
- **B1**: `0.00` (red, unfilled) – Represents an initial state or baseline.
- **B2**: `100.00` (green, filled) – Total resource pool distributed to elements.
#### Element Breakdown
| Element | E1 T (W/B) | E1 T (W/B) | E2 T (W/B) | E2 T (W/B) | E3 T (W/B) | E3 T (W/B) | E4 T (W/B) | E4 T (W/B) | E5 T (W/B) | E5 T (W/B) |
|---------|------------------|------------------|------------------|------------------|------------------|------------------|------------------|------------------|------------------|------------------|
| **W** | 29.41 | 70.59 | 29.41 | 70.59 | 1.64 | 98.36 | 0.00 | 100.00 | 7.69 | 92.31 |
| **B** | 70.59 | 29.41 | 70.59 | 29.41 | 98.36 | 1.64 | 100.00 | 0.00 | 92.31 | 7.69 |
#### Key Observations
1. **Symmetry in E1-E2**:
- E1 and E2 mirror each other: `29.41 W / 70.59 B` in T sections, reversed in B sections.
- Suggests a balanced or reciprocal relationship.
2. **E3 Anomaly**:
- T section: `1.64 W / 98.36 B` (near-total burden).
- B section: `0.00 W / 100.00 B` (pure burden).
- Indicates a critical threshold or failure state.
3. **E4 Extremes**:
- T section: `0.00 W / 100.00 B` (pure burden).
- B section: `16.67 W / 83.33 B` (partial recovery).
- Shows potential for partial mitigation.
4. **E5 Progression**:
- T section: `7.69 W / 92.31 B` (moderate burden).
- B section: `21.79 W / 78.21 B` (improved balance).
- Demonstrates incremental improvement.
### Interpretation
This diagram models a resource allocation system where:
1. The **Box** represents a total resource (100 units) distributed to five elements (E1-E5).
2. Each element splits resources into **W** (beneficial) and **B** (detrimental) components.
3. The **T sections** act as intermediate states, showing transitional resource distribution.
4. **E3** represents a critical failure point (near-total burden), while **E5** shows recovery potential.
5. The hierarchical structure implies cascading effects: changes in the Box propagate through elements, with T sections acting as buffers or transformation layers.
The system appears to track resource efficiency, with green (W) values indicating productive allocation and red (B) values representing waste or risk. The mirrored E1-E2 pairs suggest symmetrical processes, while E3's extreme values highlight system vulnerabilities. E4 and E5 demonstrate recovery dynamics, with E5 showing the most balanced outcome.