## Chart: AntNet Normalized Power Vs. Routing Overhead
### Overview
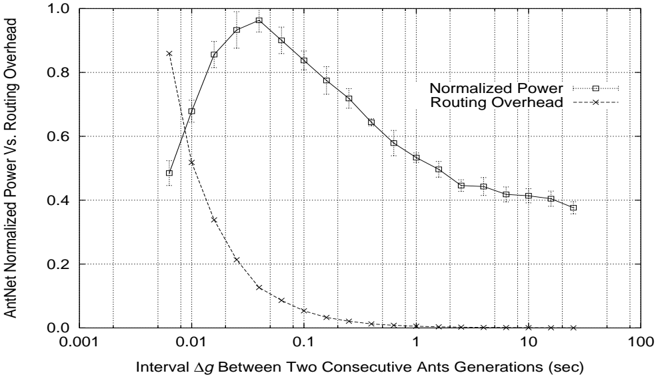
The image is a line chart comparing "Normalized Power" and "Routing Overhead" of the AntNet algorithm, plotted against the "Interval Δg Between Two Consecutive Ants Generations (sec)". The x-axis is logarithmic. The chart shows how these two metrics change as the interval between ant generations increases.
### Components/Axes
* **Title:** AntNet Normalized Power Vs. Routing Overhead
* **X-axis:**
* Label: Interval Δg Between Two Consecutive Ants Generations (sec)
* Scale: Logarithmic
* Markers: 0.001, 0.01, 0.1, 1, 10, 100
* **Y-axis:**
* Label: AntNet Normalized Power Vs. Routing Overhead
* Scale: Linear, from 0.0 to 1.0
* Markers: 0.0, 0.2, 0.4, 0.6, 0.8, 1.0
* **Legend:** Located in the top-right corner of the chart.
* Normalized Power (solid line with square markers)
* Routing Overhead (dashed line with cross markers)
### Detailed Analysis
* **Normalized Power:**
* Trend: Initially increases rapidly, peaks around x=0.05, then gradually decreases.
* Data Points:
* x=0.005, y=0.47 +/- 0.05
* x=0.01, y=0.65 +/- 0.05
* x=0.02, y=0.87 +/- 0.05
* x=0.05, y=0.95 +/- 0.05
* x=0.1, y=0.85 +/- 0.05
* x=0.2, y=0.75 +/- 0.05
* x=0.5, y=0.60 +/- 0.05
* x=1, y=0.52 +/- 0.05
* x=2, y=0.47 +/- 0.05
* x=5, y=0.44 +/- 0.05
* x=10, y=0.42 +/- 0.05
* x=20, y=0.40 +/- 0.05
* **Routing Overhead:**
* Trend: Decreases rapidly as the interval increases.
* Data Points:
* x=0.005, y=0.86
* x=0.01, y=0.52
* x=0.02, y=0.34
* x=0.05, y=0.12
* x=0.1, y=0.04
* x=0.2, y=0.01
* x=0.5, y=0.005
* x=1, y=0.002
* x=2, y=0.001
* x=5, y=0.0005
* x=10, y=0.0002
* x=20, y=0.0001
### Key Observations
* The Normalized Power peaks at an interval of approximately 0.05 seconds.
* The Routing Overhead decreases sharply as the interval between ant generations increases.
* There is an inverse relationship between Normalized Power and Routing Overhead, especially at lower interval values.
### Interpretation
The chart suggests that there is an optimal interval between ant generations for the AntNet algorithm. At very short intervals, the routing overhead is high, and the normalized power is relatively low. As the interval increases, the routing overhead decreases, and the normalized power increases, reaching a peak. Beyond this point, further increases in the interval lead to a decrease in normalized power, likely due to the ants not updating the routing tables frequently enough. The data indicates that a balance must be struck between minimizing routing overhead and maximizing the power of the algorithm.