## Chart: AntNet Normalized Power vs. Routing Overhead
### Overview
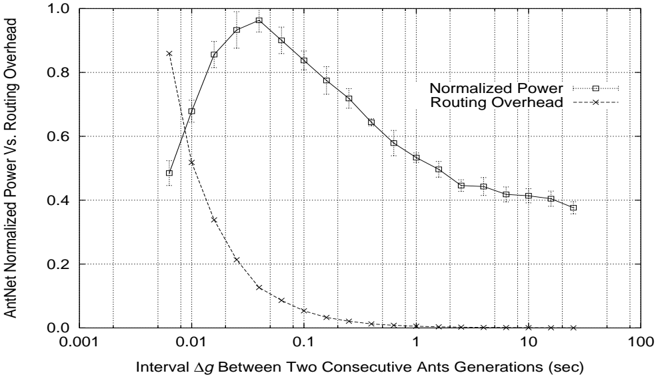
The image presents a line graph illustrating the relationship between the interval (Δg) between two consecutive ant generations (in seconds) and two performance metrics: Normalized Power and Routing Overhead, both measured on a scale from 0 to 1. The graph appears to model a network system called "AntNet".
### Components/Axes
* **X-axis:** "Interval Δg Between Two Consecutive Ants Generations (sec)". The scale is logarithmic, ranging from 0.001 to 100 seconds. The axis markers are: 0.001, 0.01, 0.1, 1, 10, 100.
* **Y-axis:** "AntNet Normalized Power Vs. Routing Overhead". The scale is linear, ranging from 0 to 1. The axis markers are: 0.0, 0.2, 0.4, 0.6, 0.8, 1.0.
* **Legend:** Located in the top-right corner.
* "Normalized Power" - represented by a dashed line with square markers.
* "Routing Overhead" - represented by a dashed line with 'x' markers.
* **Data Series:** Two lines representing the two metrics. Error bars are present for both data series, indicating the variance or uncertainty in the measurements.
### Detailed Analysis
**Normalized Power (dashed line with square markers):**
The line initially rises sharply from approximately 0.5 at 0.001 seconds to a peak of approximately 0.95 at around 0.01 seconds. It then declines gradually, leveling off around 0.45 at 100 seconds.
* 0.001 sec: ~0.5
* 0.01 sec: ~0.95
* 0.1 sec: ~0.85
* 1 sec: ~0.55
* 10 sec: ~0.45
* 100 sec: ~0.4
**Routing Overhead (dashed line with 'x' markers):**
This line exhibits an inverse relationship. It starts at approximately 0.7 at 0.001 seconds, rapidly decreases to near 0 at around 0.1 seconds, and remains close to 0 for the rest of the range.
* 0.001 sec: ~0.7
* 0.01 sec: ~0.3
* 0.1 sec: ~0.02
* 1 sec: ~0.01
* 10 sec: ~0.01
* 100 sec: ~0.01
The error bars are most prominent around the peak of the Normalized Power curve (around 0.01 seconds) and show a significant spread in the data.
### Key Observations
* There is a clear trade-off between Normalized Power and Routing Overhead. As the interval between ant generations increases, Normalized Power decreases, while Routing Overhead decreases dramatically.
* The Routing Overhead drops to near-zero values for intervals greater than 0.1 seconds.
* The Normalized Power remains relatively stable at lower intervals (above 1 second).
* The peak in Normalized Power occurs at a very small interval (0.01 seconds).
### Interpretation
The data suggests that in the AntNet system, frequent ant generations (small Δg) lead to high Normalized Power consumption but moderate Routing Overhead. Conversely, less frequent ant generations (large Δg) result in low Normalized Power consumption but very low Routing Overhead.
The logarithmic scale of the x-axis indicates that the impact of the interval is most significant at smaller values. The rapid decrease in Routing Overhead suggests that beyond a certain point (around 0.1 seconds), increasing the interval provides diminishing returns in terms of reducing overhead.
The error bars indicate that the measurements are not precise, and there is variability in the system's behavior. The peak in Normalized Power could represent a point of instability or inefficiency in the AntNet algorithm.
The graph demonstrates a fundamental optimization problem: finding the right balance between power consumption and routing efficiency in the AntNet system. The optimal interval would depend on the specific application and the relative importance of these two metrics. The data suggests that an interval around 1 second or greater might be a reasonable compromise, offering a good balance between power consumption and routing overhead.