## Line Graph: AntNet Normalized Power vs. Routing Overhead
### Overview
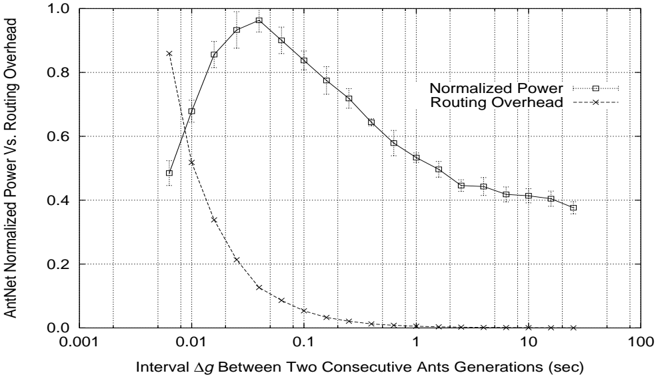
The image is a technical line graph plotting two performance metrics of an "AntNet" system against a time interval parameter. The graph uses a semi-logarithmic scale (logarithmic x-axis, linear y-axis) to show how "Normalized Power" and "Routing Overhead" change as the interval between consecutive ant generations increases. Both data series include error bars, indicating variability or confidence intervals for the measurements.
### Components/Axes
* **Chart Title:** None explicitly shown above the plot area.
* **Y-Axis:**
* **Label:** "AntNet Normalized Power Vs. Routing Overhead"
* **Scale:** Linear, ranging from 0.0 to 1.0.
* **Major Ticks:** 0.0, 0.2, 0.4, 0.6, 0.8, 1.0.
* **X-Axis:**
* **Label:** "Interval Δg Between Two Consecutive Ants Generations (sec)"
* **Scale:** Logarithmic (base 10).
* **Major Ticks (labeled):** 0.001, 0.01, 0.1, 1, 10, 100.
* **Minor Ticks:** Present between major ticks, following a logarithmic distribution.
* **Legend:**
* **Position:** Top-right quadrant of the plot area, slightly overlapping the grid.
* **Entry 1:** "Normalized Power" - Represented by a solid line with square markers (□).
* **Entry 2:** "Routing Overhead" - Represented by a dashed line with 'x' markers (×).
* **Grid:** A fine, dotted grid is present for both major and minor ticks on both axes.
### Detailed Analysis
**1. Normalized Power (Solid line, □ markers):**
* **Trend:** The line shows a clear unimodal (single-peak) trend. It rises sharply from a low value, reaches a maximum, and then gradually declines.
* **Data Points (Approximate, reading from graph):**
* At Δg ≈ 0.005 sec: Value ≈ 0.48 (with error bar from ~0.45 to ~0.51).
* At Δg ≈ 0.01 sec: Value ≈ 0.68.
* **Peak:** At Δg ≈ 0.03 sec: Value ≈ 0.95 (the highest point on the graph).
* At Δg ≈ 0.1 sec: Value ≈ 0.83.
* At Δg ≈ 1 sec: Value ≈ 0.53.
* At Δg ≈ 10 sec: Value ≈ 0.41.
* At Δg ≈ 20 sec: Value ≈ 0.38 (the last data point).
* **Error Bars:** The error bars are most pronounced around the peak (Δg ≈ 0.01 to 0.1 sec) and become smaller as Δg increases beyond 1 sec.
**2. Routing Overhead (Dashed line, × markers):**
* **Trend:** The line shows a steep, monotonic decay. It starts very high and rapidly approaches zero.
* **Data Points (Approximate, reading from graph):**
* At Δg ≈ 0.005 sec: Value ≈ 0.85 (the highest point for this series).
* At Δg ≈ 0.01 sec: Value ≈ 0.52.
* At Δg ≈ 0.02 sec: Value ≈ 0.22.
* At Δg ≈ 0.05 sec: Value ≈ 0.08.
* At Δg ≈ 0.1 sec: Value ≈ 0.03.
* At Δg ≈ 1 sec: Value ≈ 0.005 (very close to zero).
* For Δg > 1 sec: The value remains at or extremely close to 0.0.
* **Error Bars:** Error bars are visible for the first few data points (Δg < 0.1 sec) but are very small, indicating low variability in the overhead measurement.
### Key Observations
1. **Inverse Relationship at Low Intervals:** For very small generation intervals (Δg < 0.03 sec), Routing Overhead is high while Normalized Power is still climbing. They cross at approximately Δg = 0.008 sec, where both values are around 0.6.
2. **Optimal Operating Point:** The system achieves its peak Normalized Power (~0.95) at an interval of Δg ≈ 0.03 sec. At this point, the Routing Overhead has already dropped significantly to ~0.15.
3. **Diminishing Returns:** Beyond the peak (Δg > 0.03 sec), increasing the interval further causes Normalized Power to decline steadily, while Routing Overhead remains negligible. This suggests a trade-off where longer intervals reduce power efficiency without providing further meaningful reduction in overhead.
4. **Asymptotic Behavior:** Routing Overhead effectively becomes zero for intervals greater than 1 second. Normalized Power appears to be approaching an asymptotic value somewhere between 0.3 and 0.4 as Δg increases towards 100 seconds.
### Interpretation
This graph illustrates a fundamental performance trade-off in the AntNet system, likely a bio-inspired routing algorithm for networks. The "Interval Δg" is a key control parameter.
* **What the data suggests:** There is a clear "sweet spot" for the generation interval. Setting Δg too low (frequent ant generations) creates excessive network control traffic (high Routing Overhead), which consumes resources and reduces the net "Normalized Power" (likely a measure of useful throughput or efficiency). Setting Δg too high (infrequent generations) reduces overhead to near zero but also reduces the system's responsiveness and adaptability, leading to a gradual decline in power.
* **How elements relate:** The two metrics are coupled. The initial sharp drop in overhead is the primary driver for the initial sharp rise in power. After the overhead is minimized, further increases in Δg only negatively impact power, indicating the system is becoming too sluggish.
* **Notable Anomaly/Insight:** The peak in power occurs *before* the overhead is fully minimized. This indicates that the optimal operating point is not at the minimum overhead, but at a point where a small, non-zero amount of overhead is tolerated to maintain sufficient network adaptation and achieve maximum useful performance. The error bars suggest that performance (power) is most variable precisely around this optimal region, which could be important for system stability considerations.