## Line Graph: Normalized Power vs. Routing Overhead
### Overview
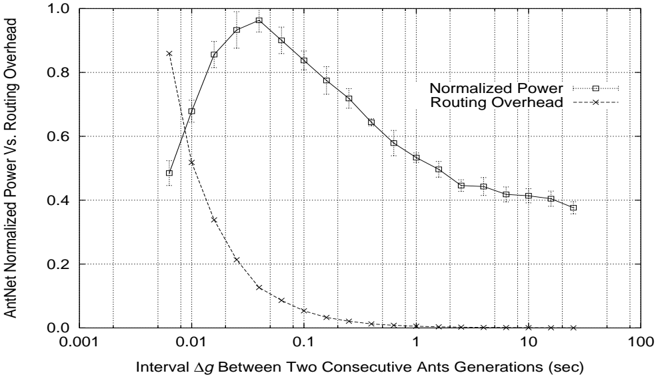
The graph illustrates the relationship between normalized power and routing overhead in AntNet as a function of the interval Δg between two consecutive ant generations. Two data series are plotted: "Normalized Power" (squares) and "Routing Overhead" (crosses), with error bars indicating uncertainty.
### Components/Axes
- **X-axis**: "Interval Δg Between Two Consecutive Ant Generations (sec)"
- Scale: Logarithmic, ranging from 0.001 to 100 seconds.
- Tick marks: 0.001, 0.01, 0.1, 1, 10, 100.
- **Y-axis**: "AntNet Normalized Power Vs. Routing Overhead"
- Scale: Linear, from 0.0 to 1.0.
- Tick marks: 0.0, 0.2, 0.4, 0.6, 0.8, 1.0.
- **Legend**: Located in the top-right corner.
- "Normalized Power": Solid squares with error bars.
- "Routing Overhead": Dashed crosses.
### Detailed Analysis
1. **Normalized Power (Squares)**:
- At Δg = 0.01 sec: ~0.5 (with error bars ±0.05).
- Peaks at Δg = 0.1 sec: ~0.9 (error bars ±0.03).
- Declines steadily after Δg = 0.1 sec, reaching ~0.4 at Δg = 10 sec.
- Error bars shrink as Δg increases, indicating reduced uncertainty.
2. **Routing Overhead (Crosses)**:
- Starts at Δg = 0.01 sec: ~0.8 (error bars ±0.1).
- Drops sharply to near 0 by Δg = 0.1 sec.
- Remains close to 0 for Δg ≥ 0.1 sec.
### Key Observations
- **Inverse Relationship**: Normalized power and routing overhead exhibit opposing trends.
- **Peak Normalized Power**: Occurs at Δg = 0.1 sec, suggesting optimal power efficiency at this interval.
- **Routing Overhead Collapse**: Overhead vanishes after Δg = 0.1 sec, indicating negligible routing costs beyond this point.
- **Error Bars**: Larger at low Δg values (e.g., ±0.1 at Δg = 0.01 sec), decreasing to ±0.03 at Δg = 0.1 sec.
### Interpretation
The data suggests a trade-off between power efficiency and routing overhead in AntNet. At small Δg intervals (≤0.1 sec), routing overhead dominates, limiting power efficiency. Beyond Δg = 0.1 sec, routing overhead becomes negligible, but power efficiency declines, possibly due to reduced communication frequency or increased computational load. The peak at Δg = 0.1 sec represents a potential optimal balance, though further analysis is needed to confirm causality. The logarithmic x-axis emphasizes sensitivity to small Δg changes, critical for fine-tuning AntNet parameters.