## Bar Chart: Truth Count Across Layers with Causal Intervention
### Overview
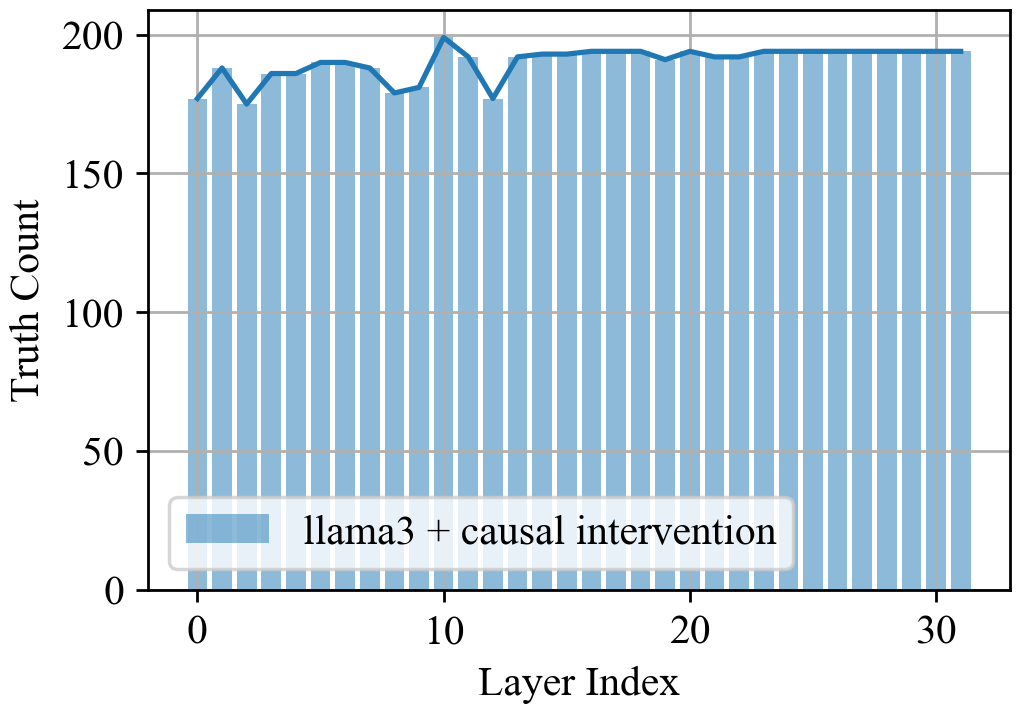
The chart displays a bar graph titled "llama3 + causal intervention," showing the relationship between layer index (x-axis) and truth count (y-axis). The data represents a sequence of 31 layers (0–30), with truth counts consistently clustered between 170–200. A notable peak occurs at layer 10, while minor dips are observed at layers 5 and 15.
### Components/Axes
- **X-axis (Layer Index)**: Labeled "Layer Index," with integer markers from 0 to 30 in increments of 1.
- **Y-axis (Truth Count)**: Labeled "Truth Count," with numerical markers from 0 to 200 in increments of 50.
- **Legend**: Positioned at the bottom-left corner, featuring a single blue bar labeled "llama3 + causal intervention."
- **Bars**: Vertical blue bars corresponding to each layer index, with heights proportional to truth count values.
### Detailed Analysis
- **Layer 0**: Truth count ≈ 180 (first bar on the left).
- **Layer 5**: Truth count ≈ 175 (notable dip below 180).
- **Layer 10**: Truth count ≈ 200 (peak value, highest bar).
- **Layer 15**: Truth count ≈ 170 (second dip, lowest observed value).
- **Layers 20–30**: Truth counts stabilize near 195–200, with minimal variation.
### Key Observations
1. **Peak at Layer 10**: The highest truth count (200) occurs at layer 10, suggesting optimal performance or intervention efficacy at this layer.
2. **Dips at Layers 5 and 15**: Truth counts drop to ~170–175 at these layers, indicating potential instability or reduced intervention effectiveness.
3. **General Stability**: Most layers (0–4, 6–9, 11–14, 16–30) maintain truth counts between 180–200, reflecting consistent performance.
### Interpretation
The data suggests that the "llama3 + causal intervention" achieves high truth counts across most layers, with a pronounced peak at layer 10. The dips at layers 5 and 15 may indicate transient failures or contextual factors affecting intervention efficacy. The overall stability implies robustness in the system, though localized anomalies warrant further investigation. The legend’s placement and color coding (blue) align with the bar chart’s visual representation, confirming data integrity.