## Chart: Truth Count vs. Layer Index for llama3 + causal intervention
### Overview
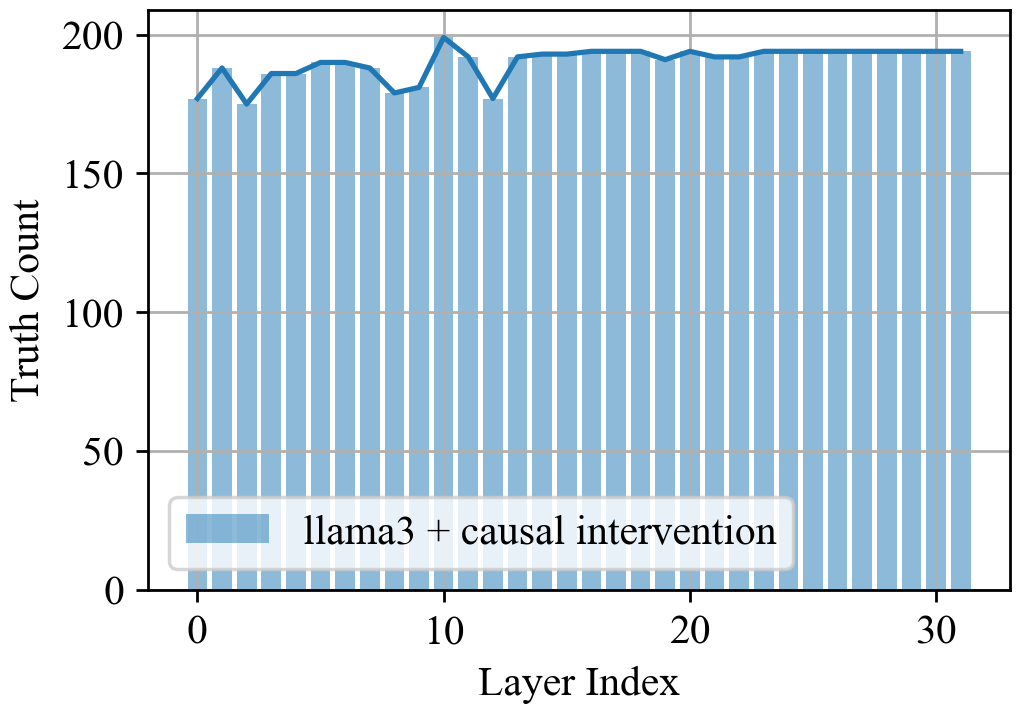
The image is a bar chart overlaid with a line graph, displaying the "Truth Count" on the y-axis against the "Layer Index" on the x-axis. The data represents the performance of "llama3 + causal intervention" across different layers. The bars are light blue, and the line is a darker blue, tracing the tops of the bars.
### Components/Axes
* **X-axis:** "Layer Index" ranging from 0 to 30 in increments of 10.
* **Y-axis:** "Truth Count" ranging from 0 to 200 in increments of 50.
* **Legend:** Located in the bottom-left corner, labeled "llama3 + causal intervention" with a light blue fill. This corresponds to the bars in the chart. The line overlaid on the bars also represents "llama3 + causal intervention".
### Detailed Analysis
* **Data Series:** "llama3 + causal intervention"
* **Trend:** The line graph shows a relatively stable "Truth Count" across the layers, with some minor fluctuations.
* **Values:**
* Layer 0: Truth Count ~180
* Layer 5: Truth Count ~190
* Layer 10: Truth Count ~180
* Layer 12: Truth Count ~200
* Layer 15: Truth Count ~190
* Layer 20: Truth Count ~195
* Layer 25: Truth Count ~195
* Layer 30: Truth Count ~195
### Key Observations
* The "Truth Count" remains relatively consistent across all layers, hovering around 190-200.
* There is a slight peak around Layer 12.
* The "Truth Count" appears to stabilize around 195 after Layer 20.
### Interpretation
The chart suggests that the "llama3 + causal intervention" model maintains a consistent level of performance (as measured by "Truth Count") across different layers. The slight peak at Layer 12 might indicate a layer of particular importance or effectiveness. The stabilization of the "Truth Count" after Layer 20 could imply that the model's performance plateaus beyond this point. The consistent performance across layers suggests a robust and stable model architecture.