# Technical Document Extraction: Truth Count vs. Layer Index
## 1. Component Isolation
* **Header:** None present.
* **Main Chart Area:** A combined bar and line chart plotted on a Cartesian coordinate system with a light gray grid.
* **Legend:** Located in the bottom-left quadrant of the chart area.
* **Axes:** Y-axis (left) and X-axis (bottom).
## 2. Metadata and Labels
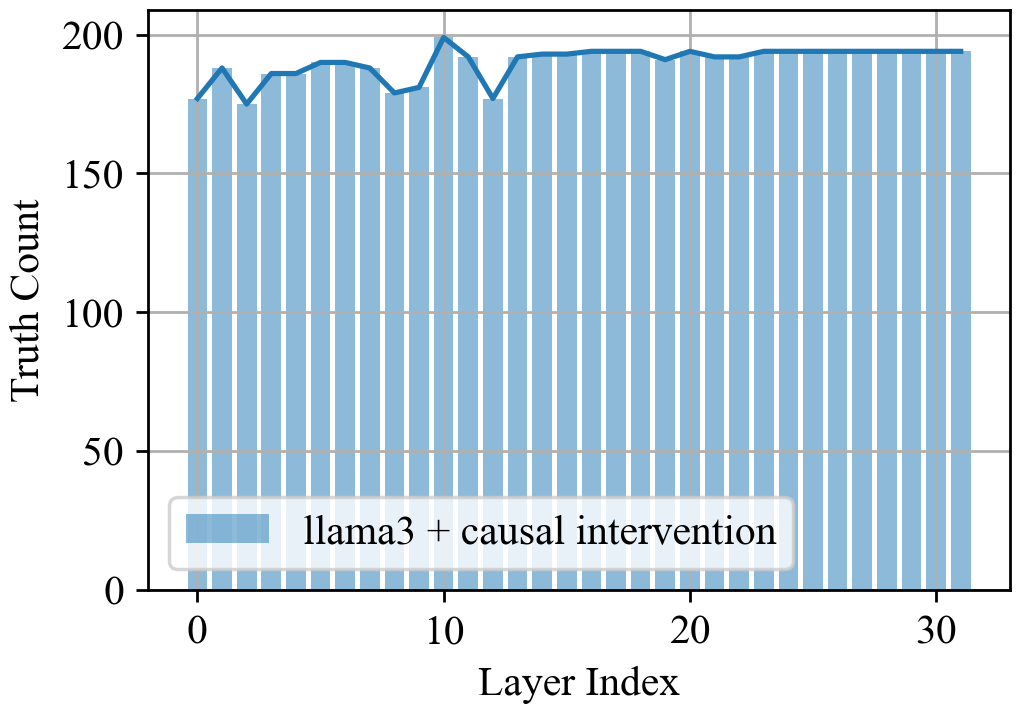
* **Y-Axis Title:** "Truth Count"
* **X-Axis Title:** "Layer Index"
* **Legend Label:** "llama3 + causal intervention" (represented by a light blue bar and a darker blue line).
* **Language:** English.
## 3. Axis Scales and Markers
* **Y-Axis Range:** 0 to 200.
* **Y-Axis Major Markers:** 0, 50, 100, 150, 200.
* **X-Axis Range:** 0 to 32 (based on the bar count and labels).
* **X-Axis Major Markers:** 0, 10, 20, 30.
## 4. Data Series Analysis: "llama3 + causal intervention"
### Trend Verification
* **Visual Trend:** The data series starts at a high baseline (approx. 175). It exhibits significant volatility and "spikiness" between Layer Index 0 and 13. After Layer 13, the values stabilize and plateau, maintaining a near-constant high value (approx. 195) through to Layer 31.
* **Spatial Grounding:** The legend is located at approximately `[x=0.05, y=0.15]` in normalized coordinates. The light blue bars and the dark blue line overlaying them both represent the same data series.
### Data Point Extraction (Estimated)
The chart contains 32 discrete bars corresponding to Layer Indices 0 through 31.
| Layer Index | Estimated Truth Count | Observation |
| :--- | :--- | :--- |
| 0 | 176 | Starting point |
| 1 | 188 | Local peak |
| 2 | 175 | Local dip |
| 3-7 | 185 - 190 | Slight upward trend with minor fluctuations |
| 8 | 179 | Local dip |
| 9 | 181 | Slight recovery |
| 10 | 199 | Highest peak in the first half |
| 11 | 191 | Decrease |
| 12 | 177 | Significant dip |
| 13 | 192 | Sharp recovery |
| 14-17 | ~194 | Stabilization begins |
| 18 | 194 | Minor peak |
| 19 | 191 | Minor dip |
| 20 | 194 | Minor peak |
| 21-22 | ~192 | Slight dip |
| 23-31 | ~195 | Consistent plateau; maximum stability |
## 5. Summary of Findings
The chart illustrates the effect of "causal intervention" on the "llama3" model across its internal layers. The "Truth Count" is relatively high throughout the model but shows instability in the earlier layers (0-12). A notable peak occurs at Layer 10, followed by a sharp drop at Layer 12. From Layer 13 onwards, the intervention results in a highly stable and consistently high Truth Count, suggesting that the causal intervention is most effective or settled in the latter two-thirds of the model's architecture.