\n
## Bar Chart: Truth Count vs. Layer Index
### Overview
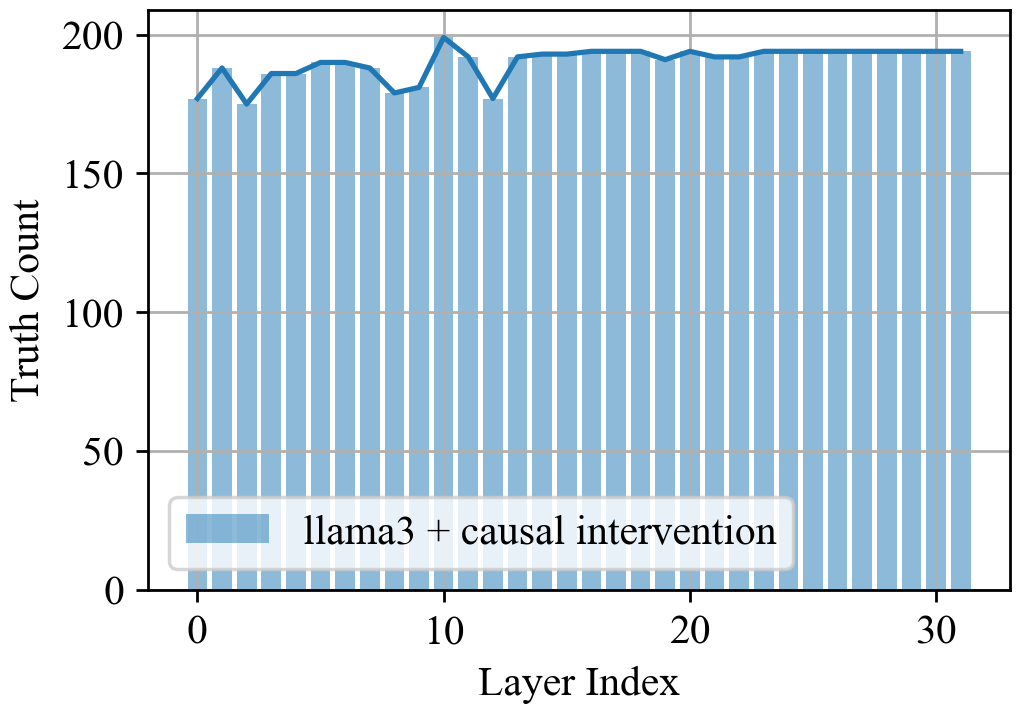
The image presents a bar chart illustrating the "Truth Count" across different "Layer Index" values. The chart displays the results of "llama3 + causal intervention". The chart consists of vertical bars representing the truth count for each layer index.
### Components/Axes
* **X-axis:** "Layer Index", ranging from approximately 0 to 32. The axis is marked with tick intervals at integer values.
* **Y-axis:** "Truth Count", ranging from 0 to 200. The axis is marked with tick intervals at increments of 50.
* **Legend:** Located in the bottom-left corner, labeled "llama3 + causal intervention". The legend uses a light blue color to represent the data series.
### Detailed Analysis
The chart shows a series of bars, each representing the truth count for a specific layer index.
* **Initial Trend (Layer Index 0-5):** The truth count initially rises from approximately 170 at Layer Index 0 to a peak of around 190 at Layer Index 3.
* **Fluctuation (Layer Index 5-15):** The truth count fluctuates between approximately 175 and 195. There's a dip around Layer Index 8, reaching a low of approximately 175.
* **Stabilization (Layer Index 15-32):** From Layer Index 15 onwards, the truth count stabilizes around 185-195, with minor variations.
Approximate data points (read from the chart):
* Layer Index 0: ~170
* Layer Index 2: ~180
* Layer Index 4: ~190
* Layer Index 6: ~185
* Layer Index 8: ~175
* Layer Index 10: ~180
* Layer Index 12: ~190
* Layer Index 14: ~185
* Layer Index 16: ~190
* Layer Index 18: ~185
* Layer Index 20: ~190
* Layer Index 22: ~185
* Layer Index 24: ~190
* Layer Index 26: ~185
* Layer Index 28: ~190
* Layer Index 30: ~195
* Layer Index 32: ~190
### Key Observations
The truth count generally remains relatively stable across the layer indices, with a slight initial increase followed by fluctuations and eventual stabilization. The fluctuations are within a range of approximately 20 truth counts. There are no significant outliers or dramatic changes in the truth count.
### Interpretation
The chart suggests that the "llama3 + causal intervention" method maintains a consistent level of truth count across different layers. The initial increase might indicate a period of learning or adjustment, while the subsequent fluctuations could be due to the inherent complexity of the data or the intervention process. The stabilization suggests that the method reaches a steady state after a certain number of layers. The relatively narrow range of truth counts indicates a reliable and consistent performance of the method. The data does not reveal the nature of the "truth" being counted, or the specific meaning of "layer index" within the context of the llama3 model and causal intervention. Further context would be needed to fully interpret the significance of these findings.